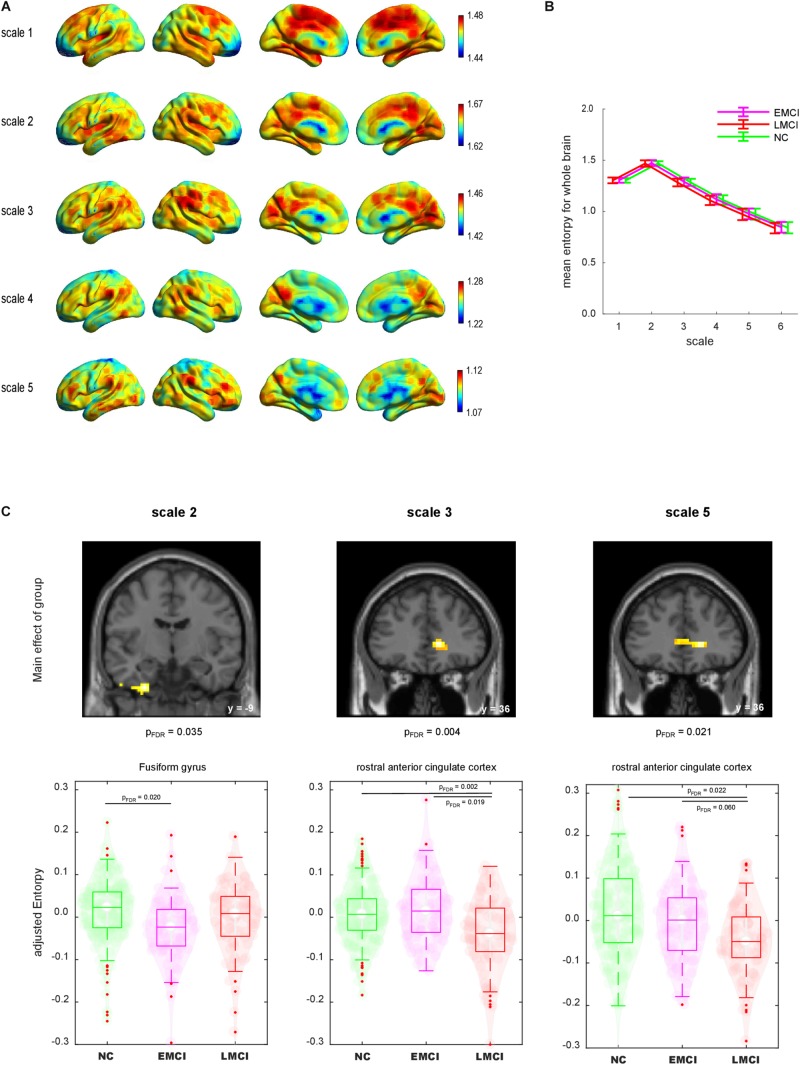
FIGURE 2.
(A) Lateral and medial views of mean maps of sample entropy for scales 1–6. The value range was different for each scale. (B) Mean sample entropy of the whole brain for scales 1–6. Error bar denotes standard deviation. (C) Group comparisons of sample entropy using whole-brain ANCOVA. Top: Brain regions displayed significant main effects of group (voxel level p < 0.001 and cluster level false-discovery rate corrected p < 0.05). Bottom: Violin plot of each individual sample entropy value. Boxes indicate the mean and interquartile. Whiskers indicate the interquartile range. NC, normal control; EMCI, early mild cognitive impairment; LMCI, late mild cognitive impairment.

