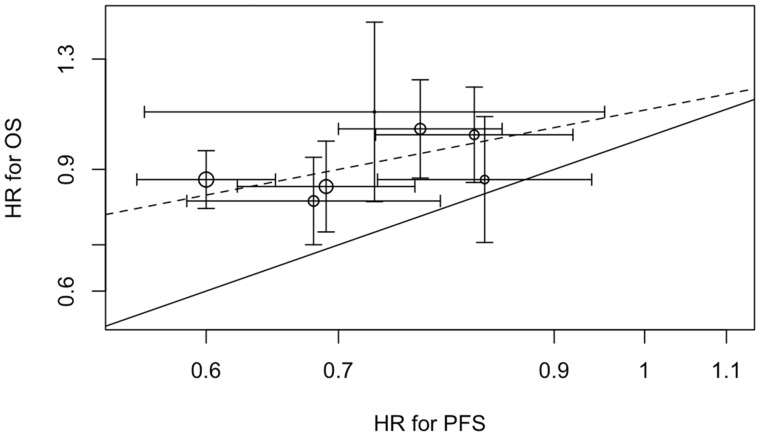
Figure 2.
Association of trial-level PFS hazard ratio (HR) and OS hazard ratio. The graph shows the association of trial-level PFS and OS effects expressed as hazard ratios. The solid line represents equality between OS and PFS effects. The dashed line represents the estimated slope of the linear association from the random-effects model. Areas of circles are proportional to trial sample sizes, and horizontal and vertical line segments represent 95% confidence intervals for the trial-level hazard ratios. OS = overall survival; PFS = progression-free survival.

