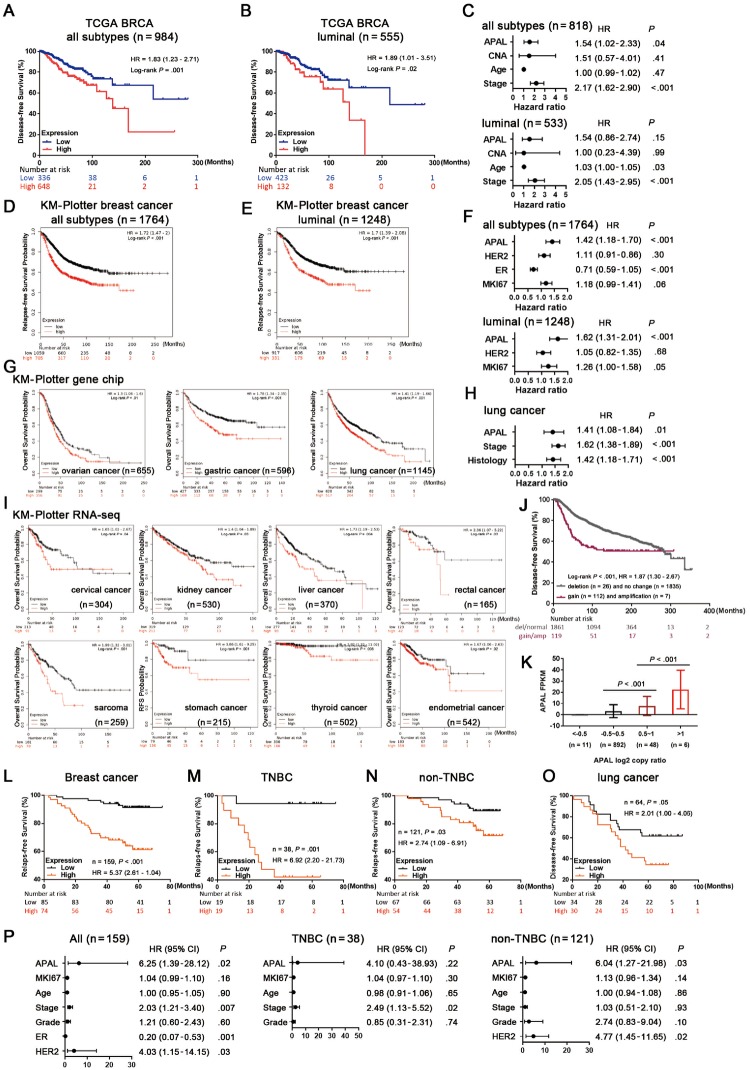
Figure 2.
Association of Aurora A/PLK1–associated long noncoding RNAs (APAL expression with clinical outcome of cancer patients. A–B) Association of APAL expression with disease-free survival (DFS) in all breast cancer patients (n = 984) and luminal breast cancer subtype (n = 555) in The Cancer Genome Atlas (TCGA) BRCA. C) Multivariable Cox regression for APAL, copy number alteration burden, age, and tumor stage with DFS in all breast cancer patients (n = 818) and luminal subtype (n = 533) in TCGA BRCA. D–E) Association of APAL expression with relapse-free survival (RFS) in all breast cancer patients (n = 1764) and luminal subtype (n = 1248) in the Kaplan-Meier Plotter (KM-Plotter) database with gene chip meta data. F) Multivariable Cox regression for APAL, HER2, estrogen receptor (ER), and MKI67 expression with RFS in all breast cancer patients (n = 1764) and luminal subtype (n = 1248) in the KM-Plotter database with gene chip metadata. G) Association of APAL expression with overall survival (OS) in ovarian, gastric, and lung cancer patients in the KM-Plotter database with gene chip metadata. H) Multivariable Cox regression for APAL, tumor stage, and histology with OS in the KM-Plotter database with lung cancer gene chip metadata. I) Association of APAL expression with patient outcomes of pan-cancer in the KM-Plotter database with RNA sequence metadata. J) Association of APAL gene gain or amplification with DFS in METABRIC breast cancer data. K) APAL expression in tumors with gene amplification (log2 copy ratio>1), genomic gains (log2 copy ratio 0.5∼1), or those without genomic gains (log2 copy ratio < 0.5) in TCGA BRCA (n = 957). L–N) Association of APAL in situ hybridization (ISH) staining in paraffin-embedded tissues with RFS of all breast cancer patients and triple-negative breast cancer (TNBC) or non-TNBC subgroups in the in-house cohort of breast cancer. O) Association of APAL ISH staining in paraffin-embedded tissues with DFS of the in-house cohort of lung cancer patients. P) Cox regression for APAL and other predictors with RFS in all breast cancer, TNBC, and non-TNBC patients. P value was based on two-sided log-rank test for Kaplan-Meier curves or Cox regression test for multivariable analysis. See also Supplementary Figure 1 (available online). CI = confidence interval; HR = hazard ratio.

