-
A
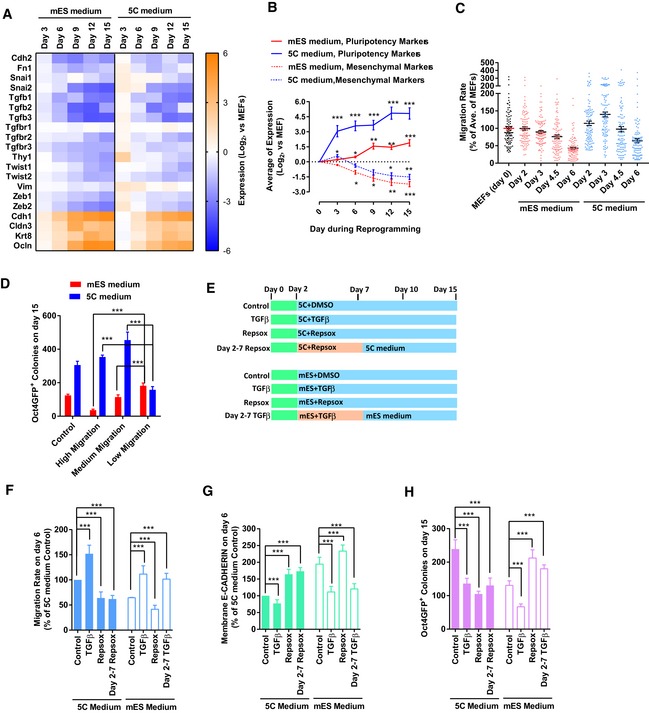
Expression of several epithelial and mesenchymal markers was determined with qPCR at different time points during reprogramming with 5C or mES medium.
-
B
The average expression of pluripotency markers and mesenchymal markers was calculated and plotted at different time points during reprogramming based on Figs
1C and EV1A.
-
C
Cell migration was determined at the early stage (days 0–6) during reprogramming with live‐cell imaging. Live‐cell imaging recorded the actual distance traveled by each individual cell within 1 h.
-
D
Cells were separated into three groups (high, one‐third of cells with the highest migration; low, one‐third of cells with the lowest migration; and medium, the other one‐third of cells) based on their migration abilities on day 3 during reprogramming. Reprogramming of these cells was traced via live‐cell imaging. The number of Oct4GFP+ colonies on day 15 converted from different groups of cells was summarized. “Control” was the average of Oct4GFP+ colonies generated from these three groups of cells.
-
E–H
TGFβ (TGFβ1/2/3, 1 ng/ml each) and RepSox (1 μM) were used during reprogramming from days 2–7 or during the whole process (E). The cell migration (F) and E‐CADHERIN expression (G) were determined on day 6 with live‐cell imaging and FACS, respectively. The number of Oct4GFP+ colonies (H) was determined on day 15.
Data information: Experiments were independently repeated at least five times (
n ≥ 5). Error bars represent standard deviations. *
P < 0.05, **
P < 0.01, ***
P < 0.001. Additional statistical information is listed in
Dataset EV7.

