-
A
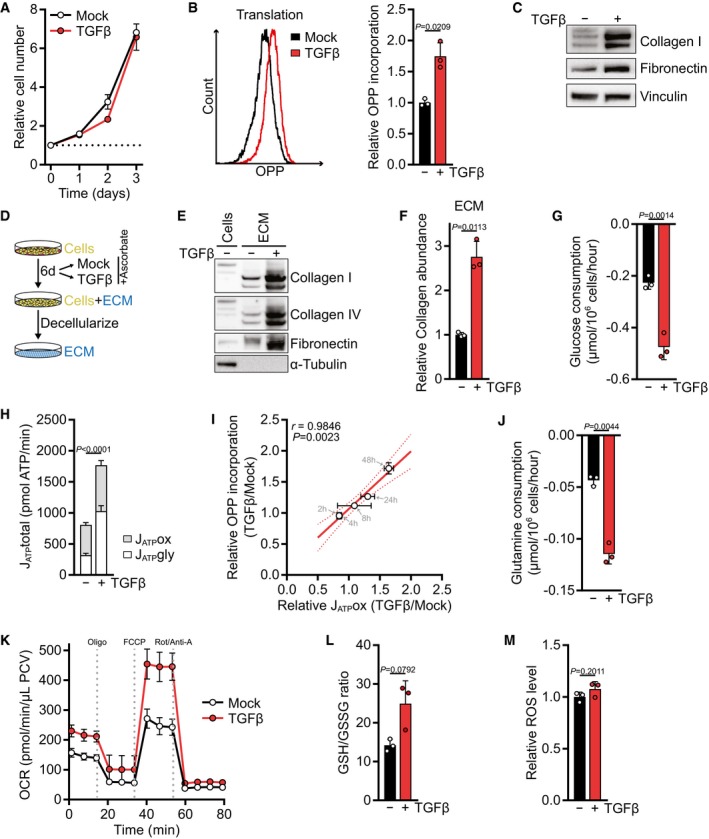
Growth curve of NIH‐3T3 cells treated with TGFβ (2 ng/ml for all experiments) or vehicle alone (mock) for the indicated time. The cell number at the indicated days relative to the number at the start of the treatment (d0) is shown. The dotted line represents the cell number at d0.
-
B
NIH‐3T3 cells were treated with TGFβ or mock for 48 h and incubated with O‐propargyl‐puromycin (OPP) for the last 60 min. The translation rate was determined by flow cytometry for OPP incorporation into proteins. A representative plot is shown on the left, and the quantification is shown on the right. Values are relative to mock‐treated cells.
-
C
Western blot of NIH‐3T3 cells treated with TGFβ or mock for 48 h.
-
D
Schematic of extracellular matrix (ECM) production in vitro.
-
E
Western blot of ECM from NIH‐3T3 cells grown in the presence or absence of TGFβ and of cell lysates from NIH‐3T3 cells grown on a parallel plate. Note the absence of tubulin and the electromobility shift of collagens in ECM extracts.
-
F
ECM was produced from NIH‐3T3 cells according to (D), and collagen abundance was measured by picrosirius red staining, normalized to the packed cell volume before ECM extraction, and expressed relative to mock‐treated cells.
-
G
NIH‐3T3 cells were treated with TGFβ or mock for 48 h. The medium was replaced in the last 12 h of the treatment (with the same treatments as before), and glucose consumption from the fresh media was measured using the YSI bioanalyzer.
-
H
ATP production rate from glycolysis (J
ATPgly) and mitochondrial oxidative phosphorylation (J
ATPox) from NIH‐3T3 cells treated with TGFβ or mock for 48 h, calculated using Seahorse data shown in (K) and Fig
EV1F.
-
I
Pearson's correlation of mitochondrial ATP production rate (J
ATPox) and OPP incorporation of NIH‐3T3 cells treated with TGFβ or mock for 2, 4, 8, 24 and 48 h, relative to mock‐treated cells. Also see Fig
EV1K and L. Note that the data points of the 2‐ and 4‐h measurements overlap.
-
J
Glutamine consumption measured as in (G).
-
K
NIH‐3T3 cells were treated with TGFβ or mock for 48 h, and the oxygen consumption rate (OCR) before and after treatment with mitochondrial inhibitors was measured using the Seahorse bioanalyzer. Oligo, oligomycin; Rot/Anti‐A, rotenone/antimycin; PCV, packed cell volume.
-
L
NIH‐3T3 cells were treated with TGFβ or mock for 48 h, and reduced (GSH) and oxidized (GSSG) glutathione were measured by LC‐MS/MS. Shown is the GSH/GSSG ratio.
-
M
NIH‐3T3 cells were treated with TGFβ for 48 h or mock and incubated with CM‐H2DCFDA for the last 30 min. ROS were measured by flow cytometry for CM‐H2DCFDA. Values are relative to mock‐treated cells.
Data information:
P‐values were calculated by two‐sided unpaired
t‐test with Welch's correction (B, F–H, J, L, M) or by Pearson's correlation analysis (I). Bars in (B, F–H, J, L, M) represent the mean + SD; data in (A, I, K) represent the mean ± SD; and line in (I) represents linear regression with the SD shown as dotted lines.
n = 3 (A, B, F, G, J, L, M);
n = 8 (H, K);
n = 5 (I). A representative experiment is shown (B, C, E).

