-
A
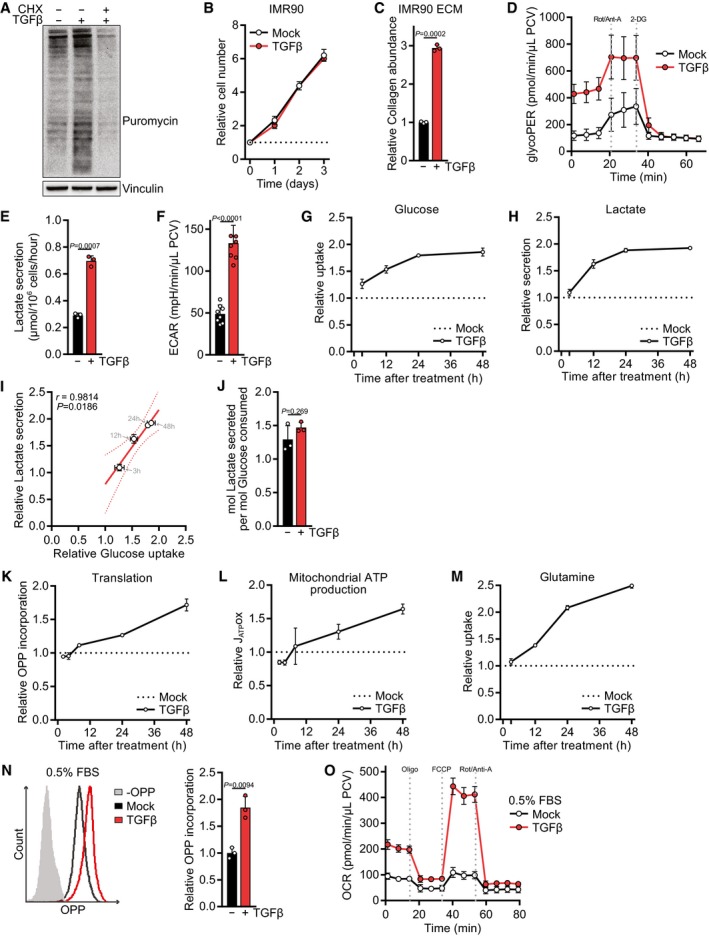
Western blot of NIH‐3T3 cells treated with TGFβ or mock for 24 h and incubated with puromycin for the last 10 min. The translation inhibitor cycloheximide (CHX) was added during puromycin incubation as a control.
-
B
Growth curve of IMR90 cells treated with TGFβ or mock for the indicated time. The cell number at the indicated days relative to the number at the start of the treatment (d0) is shown. The dotted line represents the cell number at d0.
-
C
ECM was produced from IMR90 cells grown in the presence or absence of TGFβ, and collagen abundance was measured by picrosirius red staining, normalized to the packed cell volume of cells grown on a separate plate under identical experimental conditions, and expressed relative to mock‐treated cells.
-
D
NIH‐3T3 cells were treated with TGFβ or mock for 48 h, and the glycolytic rate (glycoPER) was measured at baseline and after subsequent injection of inhibitors using the Seahorse bioanalyzer. Rot/Anti‐A, rotenone/antimycin; 2‐DG, 2‐deoxyglucose; PCV, packed cell volume.
-
E
NIH‐3T3 cells were treated with TGFβ or mock for 48 h, and lactate secretion into the medium was measured for the last 12 h of the experiment.
-
F
NIH‐3T3 cells were treated with TGFβ or mock for 48 h, and the extracellular acidification rate (ECAR) was measured at baseline. Data were normalized to the packed cell volume.
-
G–I
NIH‐3T3 cells were treated with TGFβ or mock for 3, 12, 24 or 48 h, and the consumption of glucose from the media (G) or the secretion of lactate into the media (H) was measured in the last 12 h of the experiment. For each time point, values of TGFβ‐treated cells were normalized to the respective mock‐treated controls. Glucose uptake and lactate secretion of TGFβ‐treated relative to mock‐treated cells for each time point were analyzed by Pearson's correlation (I).
-
J
Respiratory coupling, calculated by dividing the lactate secretion values from (E) through the glucose consumption values from Fig
1G.
-
K
NIH‐3T3 cells were treated with TGFβ or mock for 2, 4, 8, 24, or 48 h and incubated with O‐propargyl‐puromycin (OPP) for the last 60 min. The translation rate was determined by flow cytometry for OPP incorporation into proteins. For each time point, values of TGFβ‐treated cells were normalized to the respective mock‐treated controls.
-
L
NIH‐3T3 cells were treated with TGFβ or mock for 2, 4, 8, 24 or 48 h, and the oxygen consumption rate (OCR) before and after treatment with mitochondrial inhibitors was measured using the Seahorse bioanalyzer. From these data, the mitochondrial ATP production rate (JATPox) was calculated. For each time point, values of TGFβ‐treated cells were normalized to the respective mock‐treated controls.
-
M
NIH‐3T3 cells were treated with TGFβ or mock for 3, 12, 24 or 48 h, and the consumption of glutamine from the media was measured in the last 12 h of the experiment. For each time point, values of TGFβ‐treated cells were normalized to the respective mock‐treated controls.
-
N, O
NIH‐3T3 cells were serum‐deprived (0.5% FBS) and (N) treated with TGFβ or mock for 24 h and incubated with O‐propargyl‐puromycin (OPP) for the last 60 min followed by flow cytometry for OPP incorporation to measure the translation rate, or (O) treated with TGFβ for 48 h, and the oxygen consumption rate (OCR) before and after treatment with mitochondrial inhibitors was measured using the Seahorse bioanalyzer. Oligo, oligomycin. Values in (N) are relative to mock‐treated cells.
Data information:
P‐values were calculated by two‐sided unpaired
t‐test with Welch's correction (C, E, F, J, N) or by Pearson's correlation (I). Bars in (C, E, F, J, N) represent the mean + SD; data in (B, D, G–I, K–M, O) represent the mean ± SD; and line in (I) represents linear regression with the SD shown as dotted lines.
n = 3 (B, C, E, G, H, J, K, M, N);
n = 8 (D, F, O),
n = 4 (I),
n = 5–6 (L). A representative experiment is shown (A, N).

