-
A
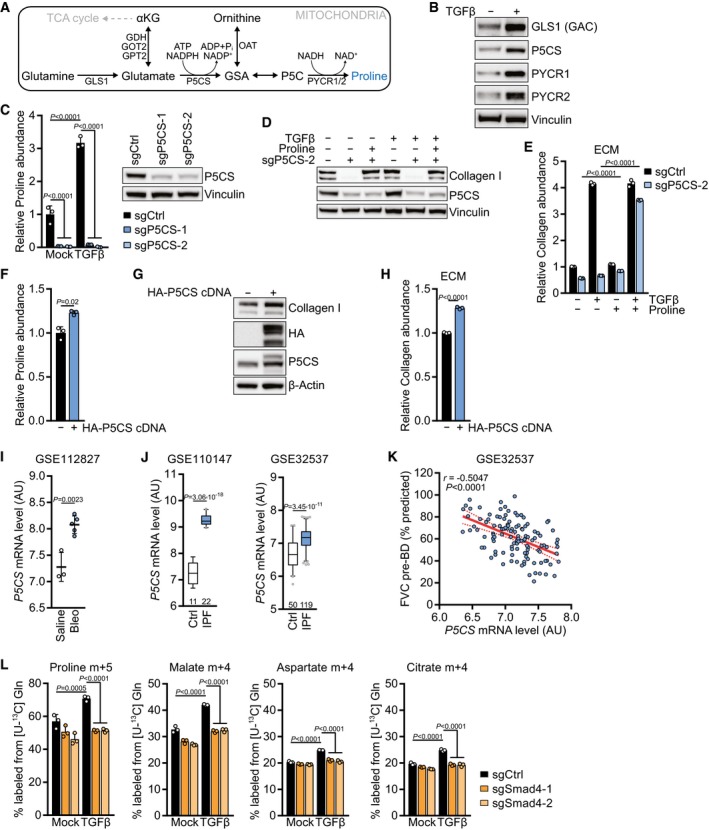
Schematic of the mitochondrial proline biosynthetic pathway.
-
B
Western blot of NIH‐3T3 cells treated with TGFβ (2 ng/ml for all experiments) or mock for 48 h in the presence of 0.5% FBS.
-
C
Left: NIH‐3T3 cells expressing sgCtrl, sgP5CS‐1, or sgP5CS‐2 were treated with TGFβ or mock for 48 h, and proline abundance was measured by GC‐MS. Values are relative to mock‐treated sgCtrl‐expressing cells. Right: Western blot of NIH‐3T3 cells expressing sgCtrl, sgP5CS‐1, or sgP5CS‐2.
-
D
Western blot of NIH‐3T3 cells expressing sgCtrl or sgP5CS‐2 and treated with TGFβ or mock for 48 h in the presence or absence of 0.15 mM proline.
-
E
Collagen abundance in ECM produced by NIH‐3T3 cells expressing sgCtrl or sgP5CS‐2 grown in the presence or absence of TGFβ and 0.15 mM proline, measured by picrosirius red staining, and normalized to the packed cell volume of cells grown on a parallel plate under identical conditions. Values are relative to mock‐treated sgCtrl‐expressing cells.
-
F
Proline abundance in NIH‐3T3 cells expressing empty vector or HA‐P5CS cDNA, measured by GC‐MS. Values are relative to mock‐treated empty vector‐expressing cells.
-
G
Western blot of NIH‐3T3 cells expressing empty vector or HA‐P5CS cDNA.
-
H
Collagen abundance in ECM produced by NIH‐3T3 cells expressing empty vector or HA‐P5CS cDNA, measured by picrosirius red staining, and normalized to the packed cell volume of cells grown on a parallel plate under identical conditions. Values are relative to mock‐treated empty vector‐expressing cells. P < 0.0001 (sgP5CS ± proline in mock and TGFβ‐treated cells).
-
I, J
Analysis of the indicated gene expression datasets for mRNA levels of
P5CS: (I) lung tissue from mice with pulmonary fibrosis induced by bleomycin (Bleo) treatment compared to saline treatment (
GSE112827); (J) two datasets (
GSE110147,
GSE32537) from lungs of patients with idiopathic pulmonary fibrosis (IPF) compared to normal controls (Ctrl). AU, arbitrary units. The number of patients per group is indicated.
-
K
Pearson's correlation of
P5CS mRNA level and forced vital capacity (FVC) before bronchodilator (pre‐BD) as percentage of what was predicted for each patient, from clinical data of
GSE32537.
-
L
Tracing of [U‐13C] l‐glutamine ([U‐13C] Gln) into indicated metabolites. NIH‐3T3 cells expressing sgCtrl, sgSmad4‐1, or sgSmad4‐2 were treated with TGFβ or mock for 48 h, and the medium was replaced (including all treatments) with DMEM without l‐glutamine and supplemented with [U‐13C] Gln for the last 8 h. Metabolites were measured by GC‐MS.
Data information:
P‐values were calculated by two‐sided unpaired
t‐test with Welch's correction (F, H), by two‐way ANOVA with Holm–Sidak multiple comparison test (C, E, L), by moderated
t‐statistics and adjustment for multiple comparisons with the Benjamini and Hochberg false discovery rate method (I, J), or by Pearson's correlation (K). Bars in (C, E, F, H, L) represent the mean + SD; lines in (I) represent the mean ± SD; data in (J) represent median with 50% confidence interval box and 95% confidence interval whiskers; and line in (K) represents linear regression with the SD shown as dotted lines.
n = 3 (C, E, F, H, L);
n = 3 (saline),
n = 5 (bleomycin) (I);
n = 11 (Ctrl, left),
n = 22 (IPF, left),
n = 50 (Ctrl, right),
n = 119 (IPF, right) (J);
n = 117 (K). A representative experiment is shown (B, C, D, G).

