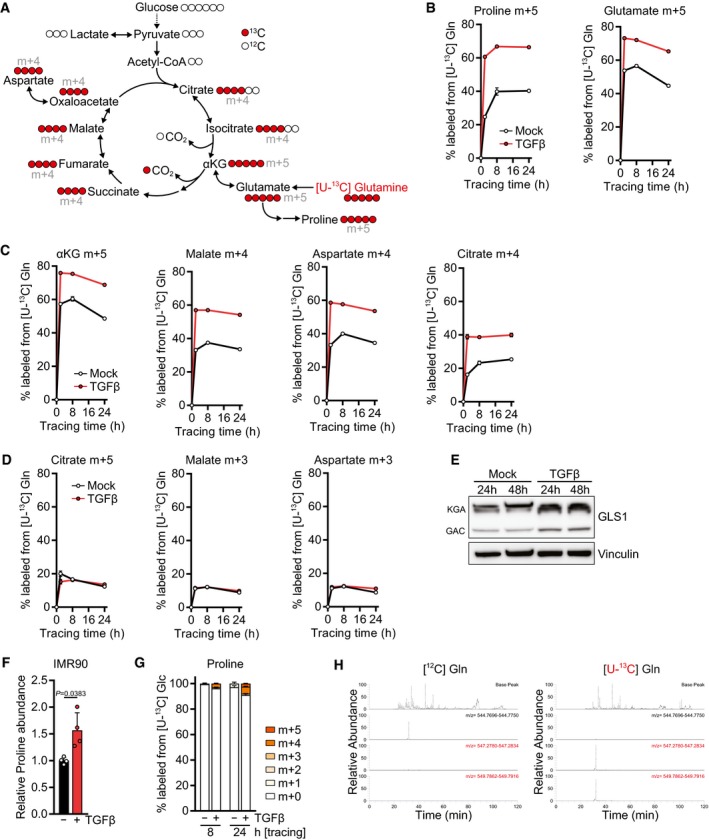
Figure EV3. TGFβ promotes proline biosynthesis and glutamine oxidation.

-
ASchematic of stable isotope tracing using l‐glutamine labeled with [13C] at all five carbons ([U‐13C] glutamine, shown in red).
-
B–DKinetic labeling curves of the indicated isotopomers after tracing with [U‐13C] glutamine ([U‐13C] Gln). NIH‐3T3 cells were treated with TGFβ or mock for 48 h, and the medium was replaced (including all treatments) with DMEM lacking l‐glutamine and supplemented with [U‐13C] Gln for the last 2, 8, or 24 h. Metabolites were measured by LC‐MS. For other isotopomers, see Fig 2C–H.
-
EWestern blot of NIH‐3T3 cells treated with TGFβ or mock for the indicated time in the presence of 0.5% FBS. KGA (kidney type) and GAC (glutaminase C) denote the two isoforms of GLS1.
-
FIMR90 cells were treated with TGFβ or mock for 48 h, and abundance of proline was measured by GC‐MS. Values are relative to mock‐treated cells.
-
GTracing of [U‐13C] glucose ([U‐13C] Glc) into proline. NIH‐3T3 cells were treated with TGFβ or mock for 48 h in DMEM lacking l‐serine and glycine in the presence of 0.5% dialyzed FBS, and the medium was replaced (including all treatments) with DMEM lacking d‐glucose, l‐serine, and glycine and supplemented with [U‐13C] Glc for the last 8 or 24 h in the presence of 0.5% dialyzed FBS. Proline was measured by LC‐MS.
-
HRepresentative MS1 spectra of the CO1A1 peptide in ECM generated with unlabeled ([12C] Gln, left) and fully labeled glutamine ([U‐13C] Gln, right). Also see Fig 2K–M.
