-
A, B
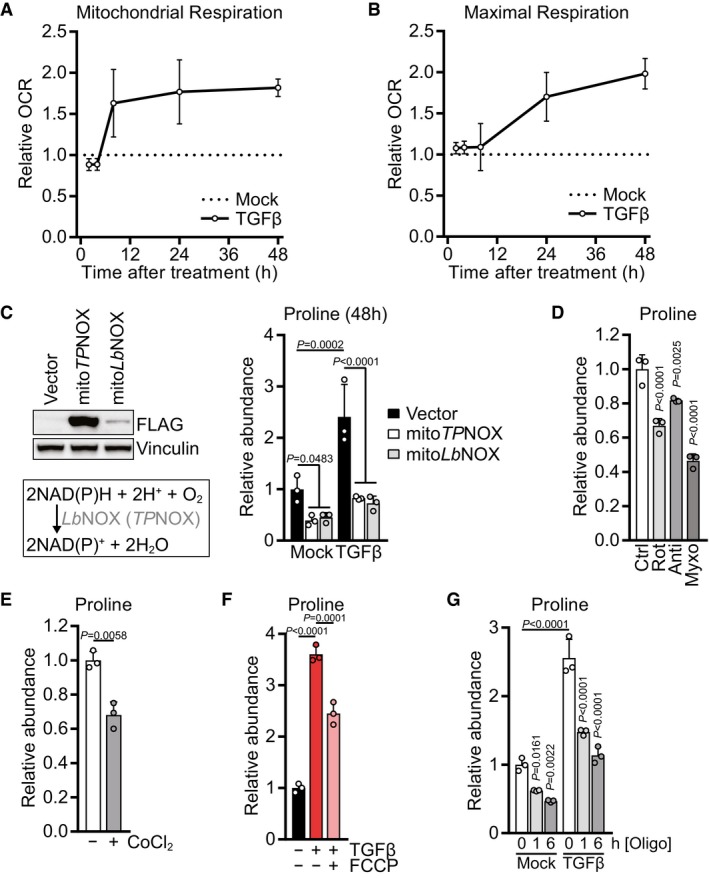
Mitochondrial basal respiration (A) and FCCP‐induced maximal respiration (B) of NIH‐3T3 cells treated with TGFβ (2 ng/ml for all experiments) or mock for 2, 4, 8, 24 or 48 h, based on Seahorse OCR measurements. The relative values were calculated by normalizing the respective values of TGFβ‐treated cells to those of mock‐treated cells for each time point.
-
C
Left: Western blot of NIH‐3T3 cells expressing empty vector, mitoTPNOX, or mitoLbNOX. MitoTPNOX or mitoLbNOX expression is detected by probing for their FLAG‐tag. Right: NIH‐3T3 cells expressing empty vector, mitoTPNOX, or mitoLbNOX were treated with TGFβ or mock for 48 h, and proline abundance was measured by GC‐MS. Values are normalized to mock‐treated empty vector‐expressing cells.
-
D
NIH‐3T3 cells were treated with rotenone, antimycin, myxothiazol, or vehicle control for 1 h, and proline abundance was measured by GC‐MS. Values are normalized to control‐treated cells.
-
E
NIH‐3T3 cells were treated with cobalt chloride (CoCl2) or vehicle control for 6 h, and proline abundance was measured by GC‐MS. Values are normalized to control‐treated cells.
-
F
NIH‐3T3 cells were treated with TGFβ or mock for 48 h, and FCCP or vehicle control was added for the last 6 h of the treatment. Proline abundance was measured by GC‐MS. Values are normalized to mock‐ and control‐treated cells.
-
G
NIH‐3T3 cells were treated with TGFβ or mock for 48 h, and oligomycin or vehicle control was added for the last 1 or 6 h of the treatment. Proline abundance was measured by GC‐MS. Values are normalized to mock‐ and control‐treated cells.
‐values were calculated by two‐way ANOVA with Holm–Sidak multiple comparison test (C, G), by one‐way ANOVA with Holm–Sidak multiple comparison test (D, F), or by two‐sided unpaired
‐test with Welch's correction (E). Bars in (C–G) represent the mean + SD; data in (A, B) represent the mean ± SD.
= 3 (C–G).

