-
A
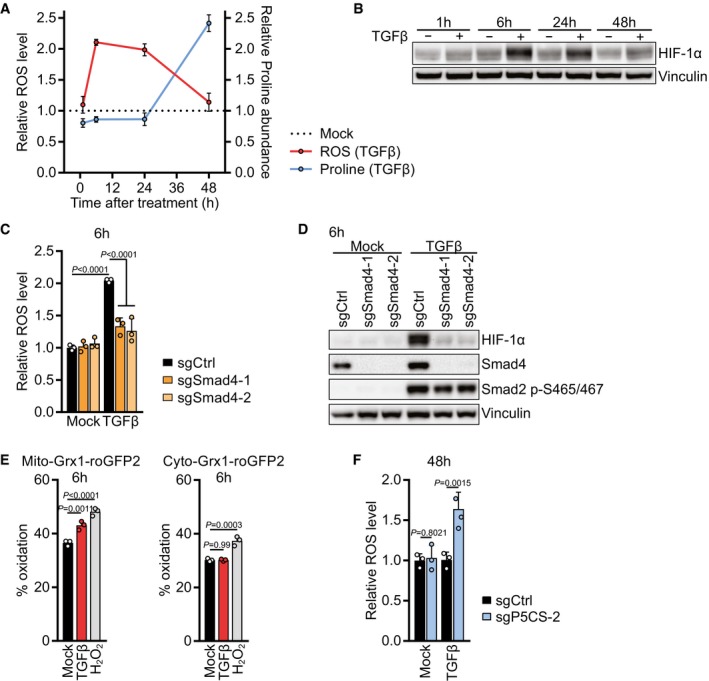
NIH‐3T3 cells were treated with TGFβ or mock for 1, 6, 24 or 48 h. ROS levels were measured by flow cytometry for CM‐H2DCFDA after incubation with CM‐H2DCFDA for the last 30 min of the treatment (Red line). Proline abundance was measured by GC‐MS (Blue line). The relative levels were calculated by normalizing the respective values of TGFβ‐treated cells to those of mock‐treated cells for each time point.
-
B
Western blot of NIH‐3T3 cells treated with TGFβ or mock for 1, 6, 24 or 48 h.
-
C
NIH‐3T3 cells expressing sgCtrl, sgSmad4‐1, or sgSmad4‐2 were treated with TGFβ or mock for 6 h, and ROS levels were measured by flow cytometry for CM‐H2DCFDA after incubation with CM‐H2DCFDA for the last 30 min of the treatment. Values are normalized to mock‐treated sgCtrl‐expressing cells.
-
D
Western blot of NIH‐3T3 cells expressing sgCtrl, sgSmad4‐1, or sgSmad4‐2 and treated with TGFβ or mock for 6 h in the presence of 0.5% FBS.
-
E
NIH‐3T3 cells expressing mito‐Grx1‐roGFP2 or cyto‐Grx1‐roGFP2 were treated with TGFβ or mock for 6 h or with 100 μM H2O2 as a control. Emission was measured with a 520/10‐nm filter after excitation with 405 nm and 488 nm lasers using flow cytometry. Oxidized roGFP2 gains excitability at 405 nm and loses excitability at 488 nm. Oxidation status is expressed as percentage of maximal oxidation which was determined by treating cells with 5 mM H2O2 for 5 min before harvest.
-
F
NIH‐3T3 cells expressing sgCtrl or sgP5CS‐2 were treated with TGFβ or mock for 48 h in the presence of 0.15 mM proline. ROS levels were measured by flow cytometry for CM‐H2DCFDA after incubation with CM‐H2DCFDA for the last 30 min of the treatment.
‐values were calculated by two‐way ANOVA with Holm–Sidak multiple comparison test (C, F) or by one‐way ANOVA with Holm–Sidak multiple comparison test (E). Bars represent the mean + SD (C, E, F); data in (A) represent the mean ± SD. A representative experiment is shown (B, D).

