-
A
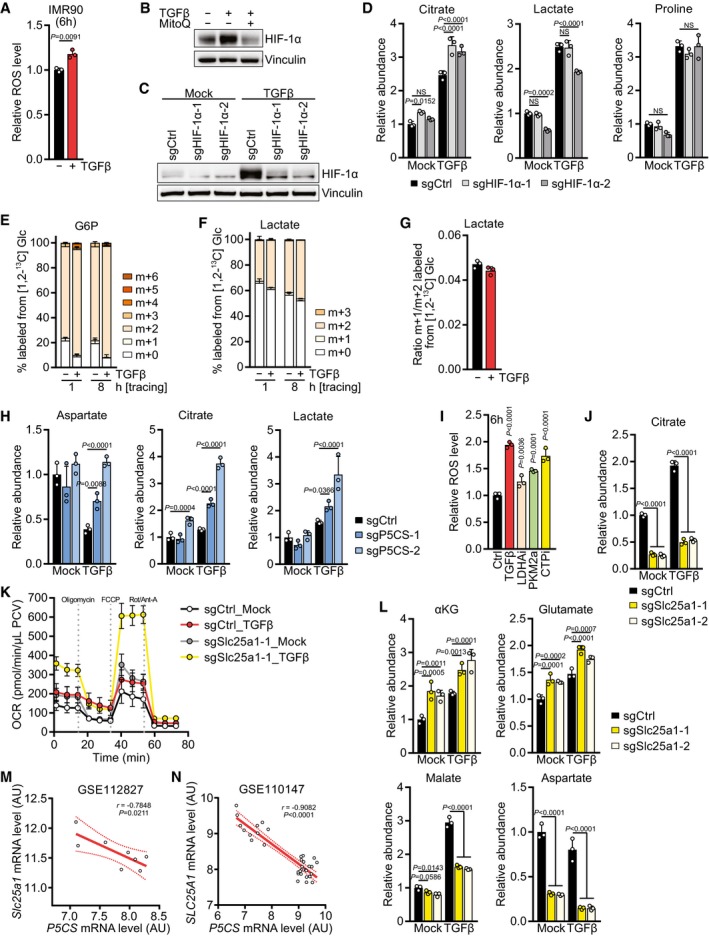
IMR90 cells were treated with TGFβ or mock for 6 h, and ROS levels were measured by flow cytometry for CM‐H2DCFDA after incubation with CM‐H2DCFDA for the last 30 min of the treatment. Values are relative to mock‐treated cells.
-
B
Western blot of NIH‐3T3 cells treated with TGFβ or mock for 6 h in the presence or absence of mitoquinol (MitoQ).
-
C
Western blot of NIH‐3T3 cells expressing sgCtrl, sgHIF‐1α‐1, or sgHIF‐1α‐2 and treated with TGFβ or mock for 6 h in the presence of 0.5% FBS.
-
D
NIH‐3T3 cells expressing sgCtrl, sgHIF‐1α‐1, or sgHIF‐1α‐2 were treated with TGFβ or mock for 48 h, and abundance of the indicated metabolites was measured by GC‐MS. Values are relative to mock‐treated sgCtrl‐expressing cells.
-
E–G
Tracing of [1,2‐13C] D‐glucose ([1,2‐13C] Glc) into (E) G6P and (F) lactate. NIH‐3T3 cells were treated with TGFβ or mock for 48 h in DMEM lacking l‐serine and glycine in the presence of 0.5% dialyzed FBS, and the medium was replaced (including all treatments) with DMEM lacking d‐glucose, l‐serine, and glycine and supplemented with [1,2‐13C] Glc for the last 1 or 8 h in the presence of 0.5% dialyzed FBS. Metabolites were measured by LC‐MS. (G) The ratio of m+1‐ versus m+2‐labeled lactate was calculated as a measure of PPP activity.
-
H
NIH‐3T3 cells expressing sgCtrl, sgP5CS‐1, or sgP5CS‐2 were treated with TGFβ or mock for 48 h, and abundance of the indicated metabolites was measured by GC‐MS. Values are relative to mock‐treated sgCtrl‐expressing cells.
-
I
NIH‐3T3 cells were treated with TGFβ, LDHAi (GSK 2837808A), PKM2a (DASA), CTPi, or vehicle control for 6 h, and ROS levels were measured by flow cytometry for CM‐H2DCFDA after incubation with CM‐H2DCFDA for the last 30 min of the treatment. Values are relative to control‐treated cells. P‐values represent comparison of individual samples to the control.
-
J
NIH‐3T3 cells expressing sgCtrl, sgSlc25a1‐1, or sgSlc25a1‐2 were treated with TGFβ or mock for 48 h, and abundance of citrate was measured by GC‐MS. Values are relative to mock‐treated sgCtrl‐expressing cells.
-
K
NIH‐3T3 cells expressing sgCtrl or sgSlc25a1‐1 were treated with TGFβ or mock for 48 h, and the oxygen consumption rate (OCR) before and after treatment with mitochondrial inhibitors was measured using the Seahorse bioanalyzer. Oligo, oligomycin; Rot/Anti‐A, rotenone/antimycin; PCV, packed cell volume.
-
L
NIH‐3T3 cells expressing sgCtrl, sgSlc25a1‐1, or sgSlc25a1‐2 were treated with TGFβ or mock for 48 h, and abundance of the indicated metabolites was measured by GC‐MS. Values are relative to mock‐treated sgCtrl‐expressing cells.
-
M, N
Pearson's correlation of
Slc25a1 and
P5CS mRNA levels in mice (M) or patients (N) from the indicated datasets, as described in Fig
3. AU, arbitrary units.
‐test with Welch's correction (A), two‐way ANOVA with Holm–Sidak multiple comparison test (D, H, J, L), by one‐way ANOVA with Holm–Sidak multiple comparison test (I), or by Pearson's Correlation (M, N). Bars in (A, D–J, L) represent the mean + SD; data in (K) represent the mean ± SD; and line in (M, N) represents linear regression with the SD shown as dotted lines. A representative experiment is shown (B, C).
= 33 (N).

