
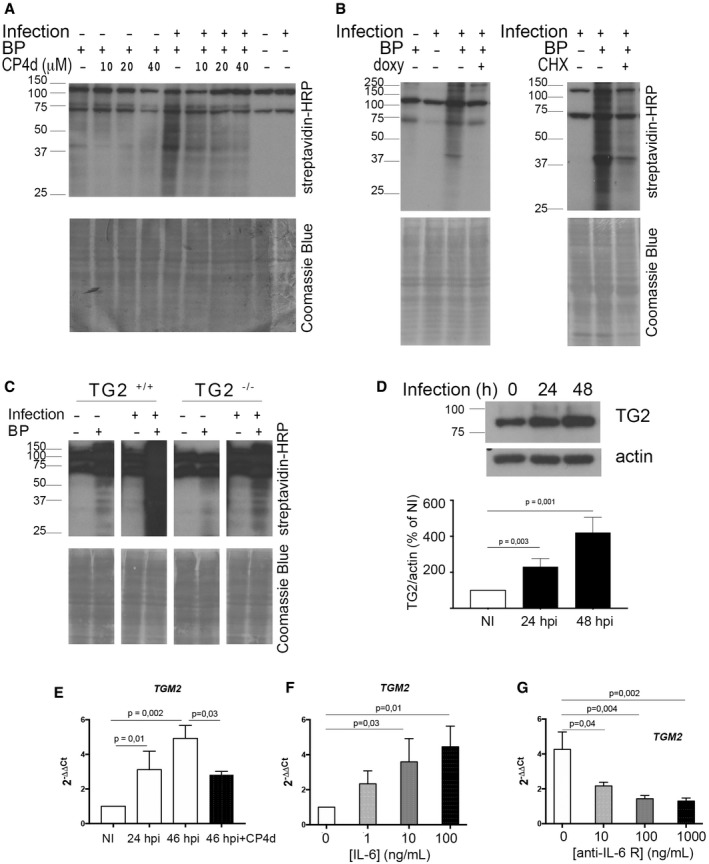
Figure 1. TG2 transamidase activity increases during C. trachomatis infection along with its expression.
-
AWhole cell lysates were prepared with HeLa cells infected or not for 48 h with C. trachomatis L2 (multiplicity of infection MOI = 1) in the presence or not of BP. In the indicated samples, CP4d was added 2 h before infection. Cell lysates were run on SDS–PAGE, proteins were transferred to a membrane, and BP incorporation was revealed with HRP‐conjugated streptavidin. BP incorporation is enhanced in infected samples and is inhibited by CP4d. The two main bands present in all samples correspond to naturally biotinylated host proteins (Haneji & Koide, 1989). After blotting, the membrane was stained with Coomassie blue to control for equal loading.
-
BSame as in (A), except that where indicated 250 μM doxycycline (doxy, left) or 7 μM cycloheximide (CHX, right) was added 24 h or 2 hpi, respectively.
-
CWhole cell lysates were prepared with TG2+/+ and TG2−/− MEFs infected or not for 48 h with C. trachomatis L2 in the presence or not of BP, and analyzed as in (A).
-
DWestern blot with anti‐TG2 antibodies on total cell lysates infected or not with C. trachomatis L2 for the indicated time. The histogram displays the mean ± SD of TG2 expression relative to actin from four independent experiments, with the results of the Student's ratio‐paired t‐test. NI: not infected.
-
ECells were infected with C. trachomatis L2 (MOI = 1) for 24 or 46 h. Where indicated, 40 μM CP4d was added 2 hpi. TGM2 transcripts were measured by real‐time RT–qPCR and normalized to actin transcripts following the ΔΔC t method. The data are presented as relative mRNA levels compared to uninfected cells and shown as the mean ± SD. Each experiment was performed in duplicate and repeated at least four times. P‐values of Student's ratio‐paired t‐test < 0.05 are shown.
-
FCells were treated for 18 h with the indicated concentration of human recombinant IL‐6 before measuring TG2 transcription relative to actin like in (E). The data are presented as relative mRNA levels compared to untreated cells and shown as the mean ± SD. Each experiment was performed in duplicate and repeated at least three times. P‐values of Student's ratio‐paired t‐test < 0.05 are shown.
-
GCells were left uninfected or infected with C. trachomatis L2 in the presence of the indicated concentration of anti‐IL‐6 receptor antibodies. Forty‐eight hours later, TG2 transcription relative to actin was measured like in (E). The data are presented as relative mRNA levels compared to uninfected/untreated cells and shown as the mean ± SD. Each experiment was performed in duplicate and repeated at least three times. P‐values of Student's ratio‐paired t‐test < 0.05 are shown.
Source data are available online for this figure.