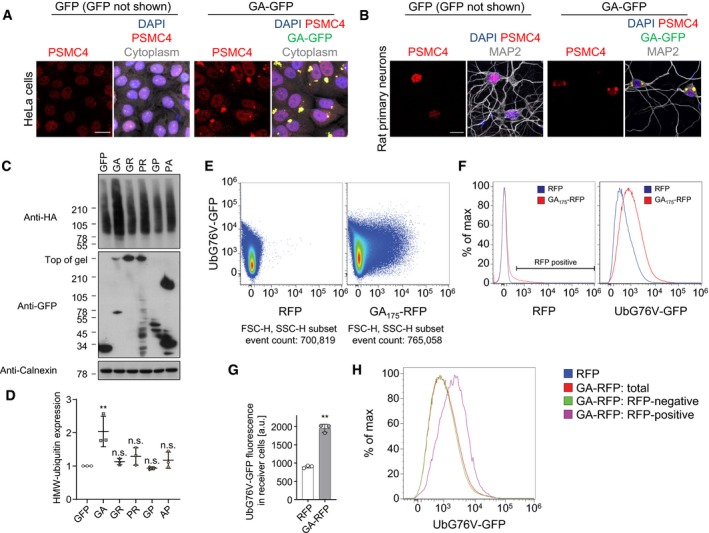
Figure EV3. Poly‐GA inclusions sequester the proteasome.

-
A, BImmunofluorescence of the proteasome subunit PSMC4 and poly‐GA inclusions in GA175‐GFP‐transfected HeLa cells and GA175‐GFP‐transduced rat primary neurons. To confirm cell viability, the cytoplasm of HeLa cells was stained with HCS CellMask™ Deep Red Stain and neuronal dendrites were labeled with MAP2. Scale bar denotes 20 μm.
-
C, DImmunoblots of HeLa cells that were co‐transfected with HA‐ubiquitin and GFP, GA175‐GFP, GFP‐GR149, PR175‐GFP, GFP‐GP47, and PA175‐GFP and incubated for 48 h and analyzed by densitometry. Scatter plot, mean ± SD. One‐way ANOVA with Tukey's multiple comparisons test. **P < 0.01.
-
E–HFlow cytometry analysis of non‐cell‐autonomous proteasome inhibition using HEK293 UbG76V‐GFP reporter cells co‐cultured for 48 h with GA175‐RFP‐ or RFP‐transfected cells. (E) Two‐color scatter plots, presented as pseudo‐color density plots, with compensated RFP fluorescence plotted on the x‐axis and compensated GFP fluorescence on the y‐axis. A representative experiment out of three independent repeats is shown. (F) Comparisons of the corresponding histograms for compensated RFP and UbG76V‐GFP fluorescence from one representative experiment that shows specific transmission of GA175‐RFP associated with accumulation of UbG76V‐GFP in cells co‐cultured with GA175‐RFP. (G) Accumulation of UbG76V‐GFP signal in non‐transfected receiver cells that were co‐incubated for 48 h with GA175‐RFP‐transfected donor cells compared with RFP control. n = 3 biological replicates. Scatter plot with bar graphs of mean ± SD. Unpaired two‐tailed t‐test with Welch's correction. **P < 0.01. (H) Histograms for UbG76V‐GFP intensity showing separate analysis of RFP‐positive and RFP‐negative receiver cells for the GA175‐RFP condition. RFP gating as indicated in (F).
Source data are available online for this figure.
