
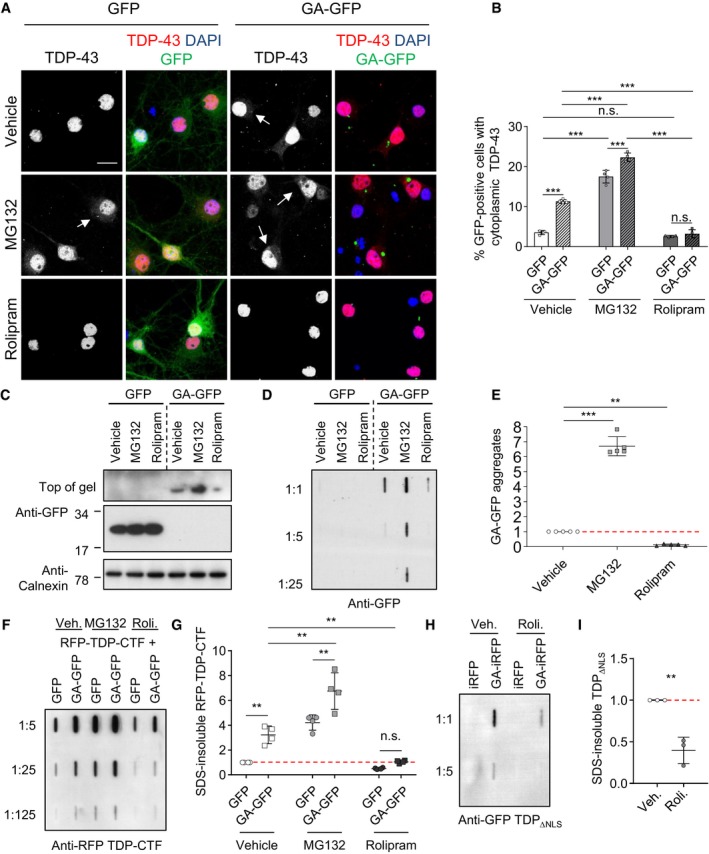
Figure 4. Rolipram rescues poly‐GA‐dependent TDP‐43 mislocalization and aggregation by boosting proteasome activity.
-
A–EPrimary hippocampal neurons were transduced with GFP or GA175‐GFP after 4 days in vitro, incubated for 7 days (DIV 4 + 7), and treated with vehicle (DMSO), MG132 (10 μM), or rolipram (30 μM) for 16 h. (A) Immunofluorescence reveals enhanced cytoplasmic TDP‐43 levels in neurons with poly‐GA aggregates or treated with MG132. Arrows mark punctate TDP‐43 staining. Rolipram treatment reduced cytoplasmic TDP‐43 in GA175‐GFP neurons. Scale bar denotes 20 μm. (B) Automated quantification of cells with cytoplasmic TDP‐43 in GFP‐ or GA175‐GFP‐transduced neurons. n = 4 biological replicates. In total, 462 GFP and 371 GA175‐GFP cells treated with vehicle, and 386 GFP and 529 GA175‐GFP cells treated with MG132, and 513 GFP and 434 GA175‐GFP cells treated with rolipram were analyzed. Scatter plot with bar graphs of mean ± SD. One‐way ANOVA with Tukey's multiple comparisons test. (C) Immunoblot to show effects of MG132 and rolipram on GA175‐GFP and GFP expression. (D and E) Filter trap assay with quantification of SDS‐insoluble aggregated GA175‐GFP. n = 5 biological replicates. Scatter plot with mean ± SD. One‐way ANOVA with Tukey's multiple comparisons test.
-
F, GHeLa cells were co‐transfected with RFP‐TDP‐CTF and GFP or GA175‐GFP for 2 days. For the final 16 h, cells were treated with rolipram (30 μM) or MG132 (10 μM). Filter trap assay of SDS‐insoluble TDP‐CTF aggregates quantified by densitometry. n = 4 biological replicates. Scatter dot plot, mean ± SD. One‐way ANOVA with Tukey's multiple comparisons test. See also Appendix Fig S3.
-
H, IHeLa cells were co‐transfected with TDP‐43ΔNLS‐GFP and iRFP or GA175‐iRFP for 2 days. For the final 16 h, cells were treated with either vehicle or rolipram (30 μM). Filter trap assay of SDS‐insoluble TDP‐43ΔNLS‐GFP aggregates quantified by densitometry. n = 3 biological replicates. Scatter dot plot, mean ± SD. One‐way ANOVA with Tukey's multiple comparisons test.