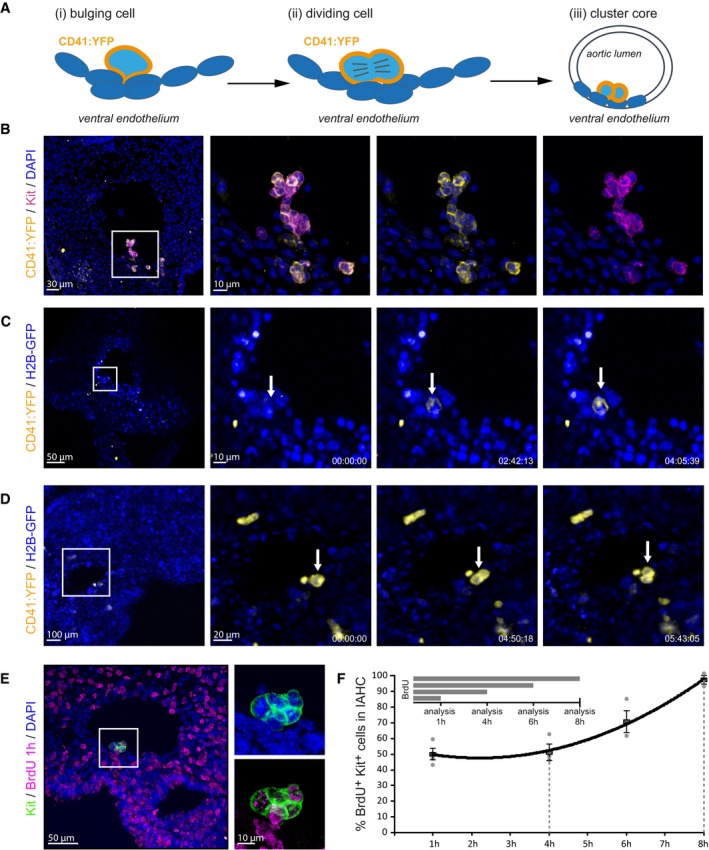
Figure 1. Bulging cells divide to form the monoclonal core of the IAHC.

- Schematic representation of initial events of IAHC formation. (i) A single cell protrudes into the lumen of the aorta and starts expressing CD41. (ii) The CD41:YFP+ bulging cell undergoes mitosis (iii), forming the core of the IAHC.
- Expression of Kit (magenta) largely overlaps with the expression of CD41:YFP (yellow) in IAHC. Multistack reconstruction of confocal images. Scale bars: 30 μm overview, 10 μm magnification.
- Snapshots of Movie EV1. Time lapse of embryonic organotypic slice culture from CD41:YFP (yellow): H2B‐GFP (blue) reporter mouse shows the emergence of a single cell protruding from the endothelial layer into the aortic lumen. Scale bars: 50 μm (overview), 10 μm (magnification). Time expressed in hh:mm:ss.
- Snapshots of Movie EV2. Time lapse of embryonic organotypic slice culture from CD41:YFP (yellow): H2B‐GFP (blue) reporter mouse shows a single CD41:YFP‐expressing cell that divides once on the aortic endothelium. Scale bars: 100 μm (overview), 20 μm (magnification). Time expressed in hh:mm:ss.
- BrdU incorporation in the Kit+ IAHC upon cumulative administration. Multistack reconstruction of confocal images. Representative picture of a short BrdU pulse (1 h). Scale bars: 50 μm (overview), 10 μm (magnification).
- Quantification of the percentage of Kit+ cells within IAHCs incorporating BrdU using confocal images. All cells (labeling index = 100%) can be labeled after 8 h, indicating the lack of quiescent cells inside the IAHCs. Graph represents mean ± SE.
