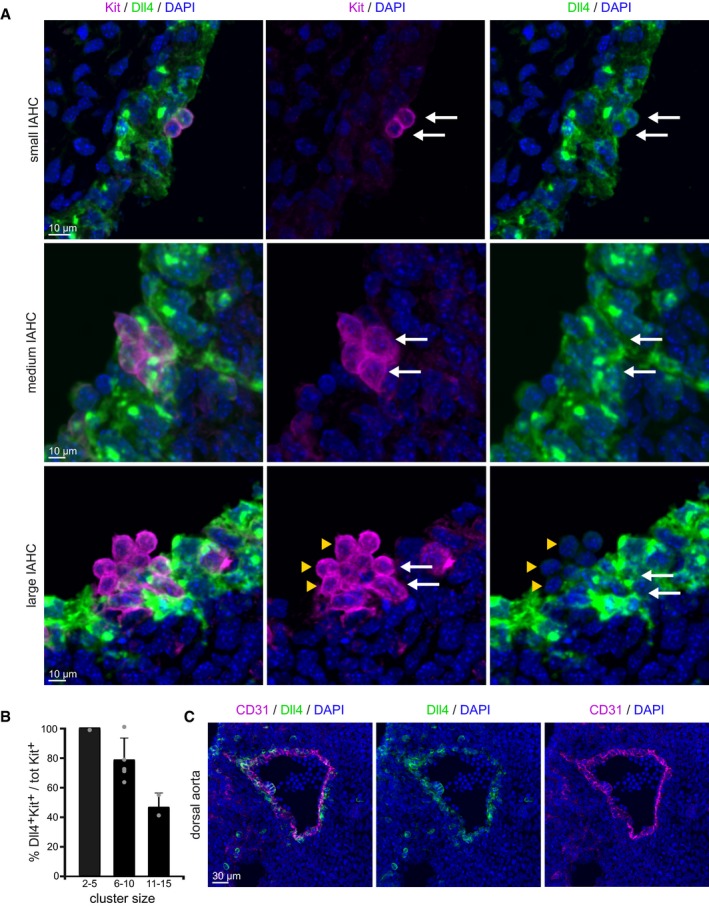
Figure 3. Dll4‐ligand expression in the IAHC varies with cluster size.

- Detail images of Dll4 staining in Kit+ cells of IAHC of different sizes. Dll4 expression inversely correlates with the size of the cluster: 2–5 cell IAHCs are uniformly Dll4‐positive (upper and middle panel), and > 5 cell IAHCs are partially Dll4‐positive (lower panel). Multistack reconstruction of confocal images. Scale bars: 10 μm.
- Quantification of Kit+ Dll4+ cells using confocal images. Bars represent the percentage of Dll4 expressing cells within a cluster in each category of cluster size. Mean ± SD (total 17 clusters analyzed, n = 2).
- Overview of Dll4‐ligand expression in the embryonic aorta at E10.5. Dll4 is expressed in the majority of the endothelial layer. Scale bar: 30 μm.
