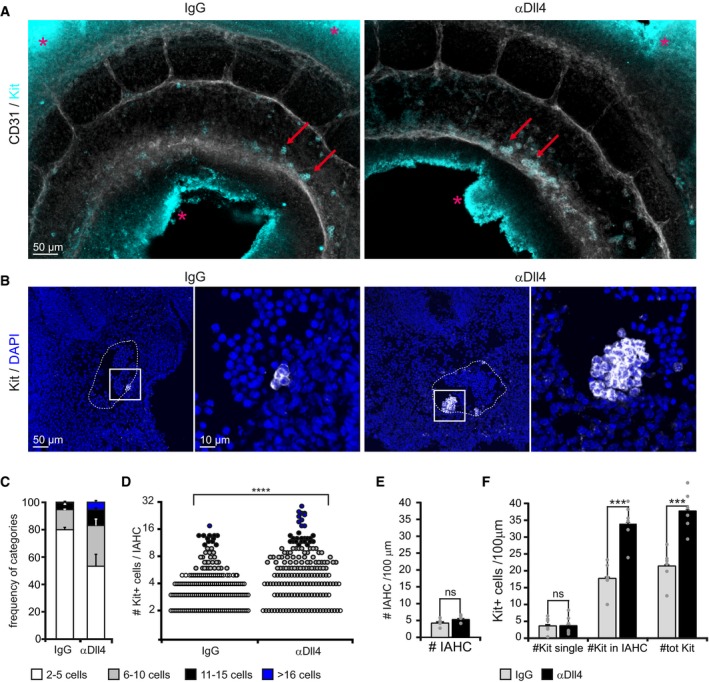
Whole‐mount images of the aorta endothelium stained for CD31 (white in image, black in label) and Kit (IAHC, cyan) upon IgG (left) or αDll4 antibody treatment (right). Multistack reconstruction of confocal images. Red arrows indicate IAHCs on the ventral part of the aortic wall. Asterisks indicate aspecific autofluorescence. Scale bar: 50 μm.
Representative IAHCs of IgG‐ and αDll4‐treated embryos. Kit is shown in white in the image and in black in the label. Multistack reconstruction of confocal images. Note the increased IAHC size in the right panel. Scale bars: 50 μm (overview) and 10 μm (magnification).
Frequency of IAHC categories based on the number of Kit+ cells forming a cluster. Quantification of confocal images. Bars represent the mean ± SE (n = 6).
Number of Kit+ cells per IAHC increases following αDll4 antibody treatment. Each dot represents one cluster. Quantification on confocal images. Statistical analysis: Mann–Whitney U‐test. ****P < 0.0001.
Total number of IAHCs per 100 μm. Quantification of confocal images. Mean ± SE. Statistical analysis: t‐test. ns P > 0.05; (n = 6).
Quantification of the number of Kit+ cells per 100 μm using confocal images. Bars represent the mean ± SE. Statistical analysis: t‐test. ns P > 0.05; ***P < 0.001 (n = 6).

