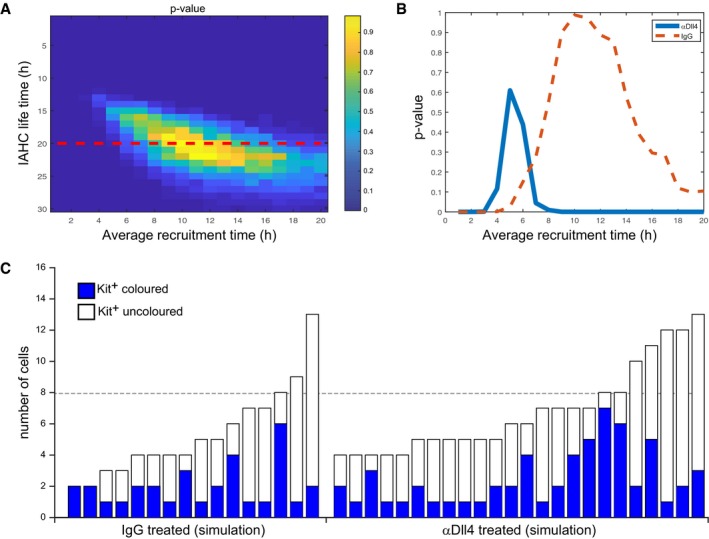
Figure EV4. Analysis using the mathematical model of the data with the two big clusters split in two.

-
A–CSimilar analysis as done in Fig 7 to the data with the two extremely large clusters divided equally into two smaller clusters each. The colored cells were also divided equally between the new clusters.
