-
A
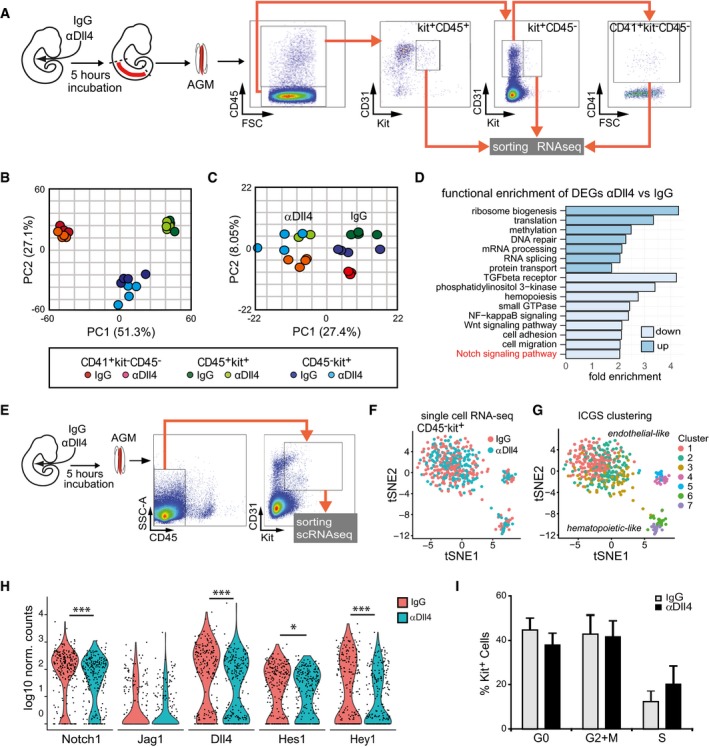
Experimental design: E10.5 embryos were injected with IgG or αDll4, incubated for 5 h, and then dissected. The indicated IAHC subpopulations (kit+CD45+; kit+CD45−; kit−CD45−CD41+) were purified, and RNA was sequenced.
-
B
PCA of the different subpopulations from IgG or αDll4‐treated embryos based on normalized gene counts.
-
C
PCA considering the DEG according to the treatment specific for each subpopulation.
-
D
Function enrichment analysis of DEG in the Kit+CD45− population according to the treatment.
-
E
Experimental design and sorting gate for Kit+CD45− cells for single‐cell RNA‐seq (n = 483 cells).
-
F, G
tSNE distribution of IgG‐ and αDll4‐treated Kit+CD45− cells from single‐cell RNA‐seq data. (F) Cells corresponding to each treatment are indicated, and (G) different clusters identified by ICGS (F) are represented. 1–3 are endothelial‐like cells, and 6–7 are hematopoietic‐like cells.
-
H
Violin plots of Notch family element expression in IgG‐ and αDll4‐treated cells (adj *P < 0.1 and ***P < 0.00001).
-
I
Percentage of cells in each cell cycle phase extracted from single‐cell RNA‐seq analysis. Bars represent the average ± SE (n = 483).