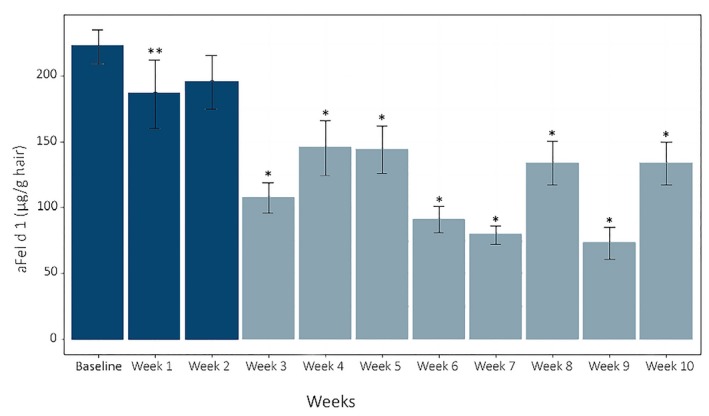
Figure 5.

Active Fel d 1 levels (µg/g hair) means and SE across weeks. Means were significantly reduced from baseline at week 1 (P < .05) and weeks 3 through 10 (P < .001) using linear mixed effect models and P‐value adjustments using the single‐step method Columns with the lighter color denote values that were statistically different from baseline (Source: CC BY 3.0, Satyaraj et al, 2019137)
