
Figure 6.
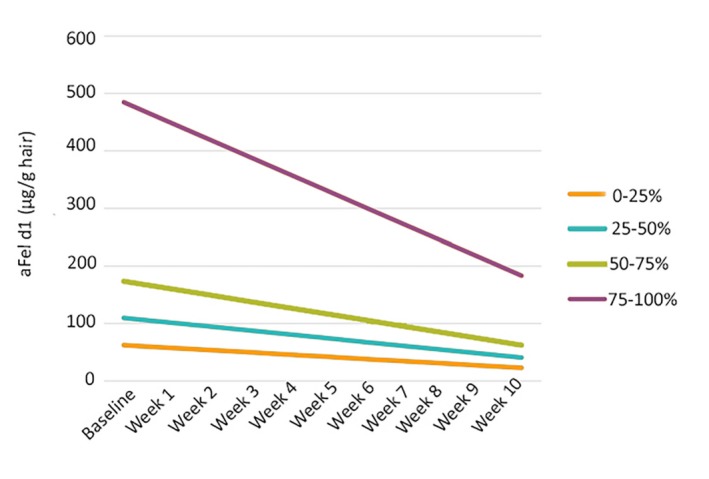
Change in active Fel d 1 (µg/g hair) means over time based on initial concentrations. Cats were divided into quartiles based on their baseline aFel d 1 levels and linear regression was used to estimate the initial level (intercept) and the change in aFel d 1 over time (slope). The graph represents a total of 1470 samples obtained during the 12‐week study. The slope of decline in aFel d 1 levels was significantly steeper for those cats in the highest quartile (P < .001) but did not differ among the three lower quartiles (P > .1) based on ANOVA with Tukey Post hoc Tests. Cats with the highest Fel d 1 production showed the greatest response to the intervention (Source: CC BY 3.0, Satyaraj et al, 2019137)