Figure 3.
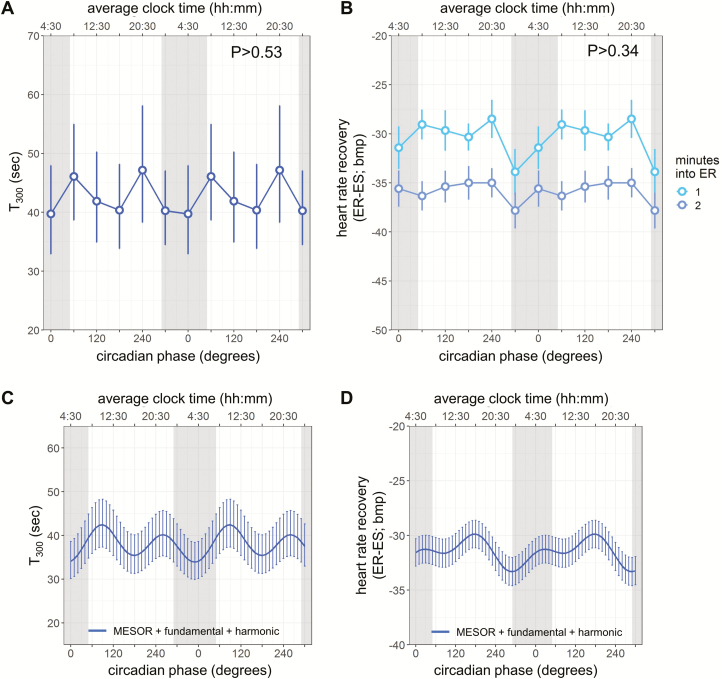
Heart rate (HR) recovery after exercise across circadian cycles. HR recovery indices are expressed in two ways: (A, C) T300, time constant obtained by fitting a first order exponential decay curve to the HR responses for the first 5 min after exercise, and (B, D) as the difference between recovery and maximal HR during exercise (previously used for prognostic purpose). Light and medium blue circles, 1 and 2 min, into exercise recovery (for B only), respectively; gray bars, group average habitual sleep episodes. (C, D) The cosinor fits to the HR recovery indices. Each model reflects the summed MESOR, circadian fundamental and harmonic components, and averaged time since recovery effects (the latter for D only). Cosinor analyses were performed on the 360° data sets, whereas data are double plotted (two identical circadian cycles) to aid visualization of rhythmicity. Lines, model fit; error bars, 95% CI in (A, C) and SEM in (B, D); p values, significance of circadian effect from cosinor analyses.

