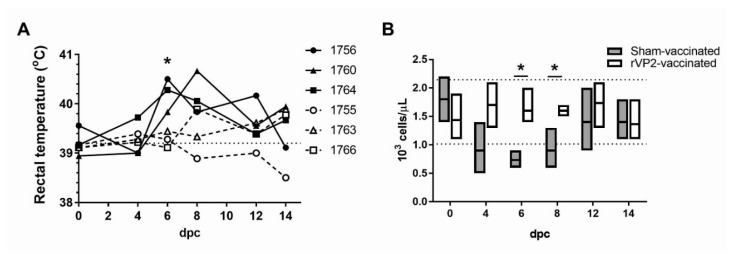
Figure 3.
Body temperatures and peripheral lymphocyte numbers in WTD following challenge with EHDV-2. (A) Rectal temperatures as measured in sham-vaccinated WTD (closed shapes, solid lines) and EHDV-2 rVP2-vaccinated WTD (open shapes, dashed lines) on 0, 4, 6, 8, 12, and 14 dpc. Horizontal dotted line indicates group mean baseline temperature. Asterisk indicates p = 0.013. (B) Lymphocyte counts performed on peripheral blood samples collected from all animals at 0, 4, 6, 8, 12, and 14 dpc, excepting #1756 on 0 dpc due to the sample clotting prior to analysis. Lines on vertical bars indicate minimum, maximum, and mean absolute lymphocyte counts for the sham-vaccinated group (grey bars) and rVP2-vaccinated group (white bars) on each sample day. Horizontal dotted lines indicate the 95% confidence interval of the group baseline mean absolute lymphocyte count at 0 dpc. Asterisks indicate p = 0.017 (6 dpc) and p = 0.032 (8 dpc).

