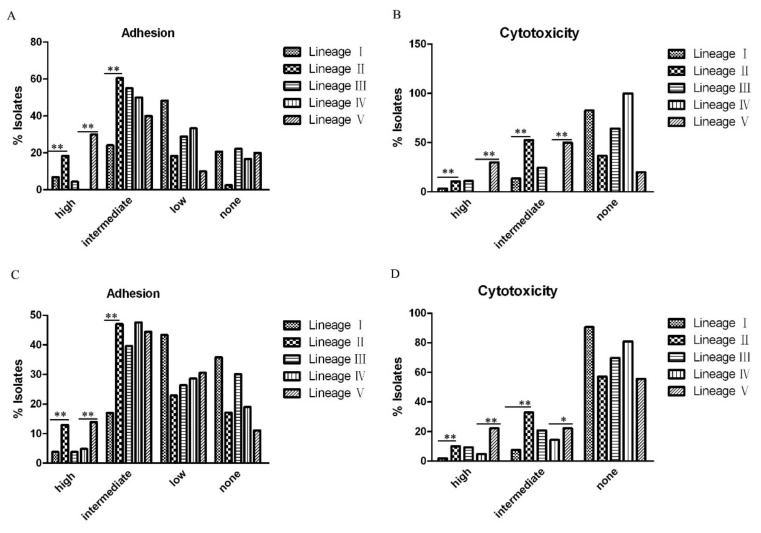
Figure 6.
The percentage of adhesive and cytotoxic isolates in different lineages. (A) and (B) The percentage of high, intermediate, little or no adhesive or cytotoxic isolates based on the 128 Citrobacter isolates from this study. (C) and (D) The percentage of high, intermediate, little or no adhesive or cytotoxic isolates in different lineages based on the128 Citrobacter isolates from this study and 95 Citrobacter isolates from our previous studies [10,16]. The statistical significance between Lineages I and II or Lineages IV and V was determined by Mann-Whitney U test. *, p < 0.05; **, p < 0.01.

