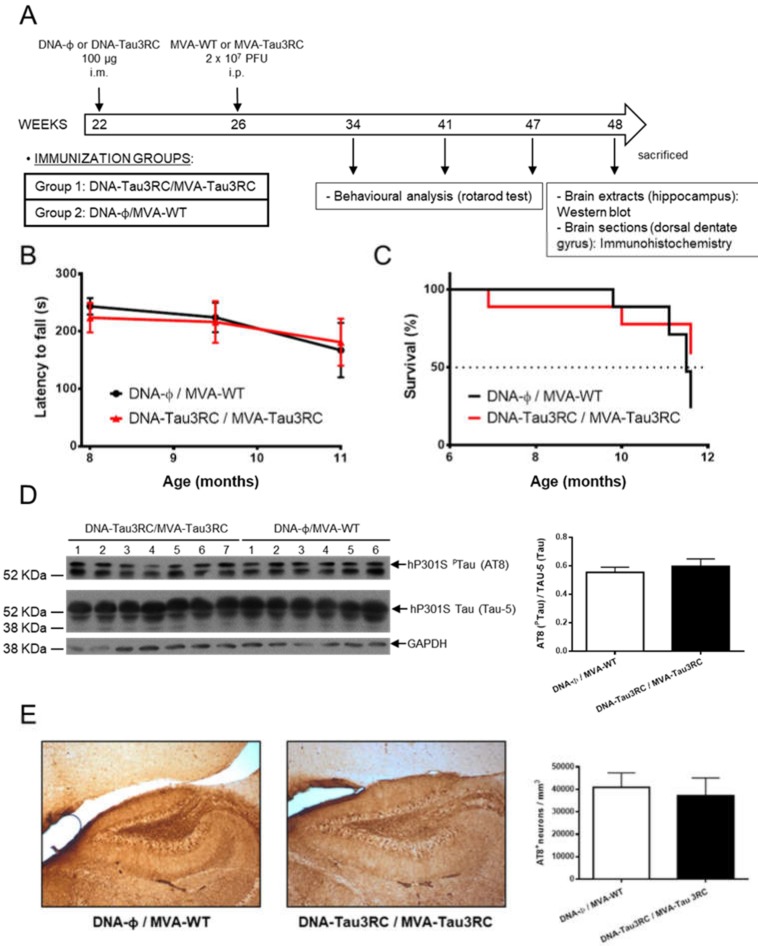
Figure 6.
Studies on efficacy of MVA-Tau3RC in transgenic P301S mice. (A) Vaccination scheme. Groups of transgenic P301S mice (n = 6–7 mice/group, 22 weeks of age) were immunized with 100 µg of DNA-Tau3RC (pSG5-Tau3RC) or DNA-Φ (pSG5) by the i.m. route. Four weeks later (week 26), animals were immunized with 2 × 10⁷ PFUs of MVA-Tau3RC or MVA-WT by the i.p. route (see Materials and Methods). At weeks 34, 41, and 47 (months 8, 9.5 and 11, respectively) rotarod test were performed and animals were sacrificed at week 48. (B) Rotarod performance evolution. The latency to fall (in seconds) in P301S animals immunized with DNA-Tau3RC/MVA-Tau3C or DNA-Φ/MVA-WT was evaluated by a rotarod test at months 8, 9.5 and 11. The mean and SD are represented. (C) Survival rate. The percentage of P301S mice immunized with DNA-Tau3RC/MVA-Tau3C or DNA-Φ/MVA-WT surviving during the length of the experiment is represented, after the booster inoculation at week 26 (month 6). (D) Detection of phosphorylated tau protein by Western blot in hippocampal samples of vaccinated P301S mice. Levels of phosphorylated human tau (hP301S PTau) protein and total human tau (hP301S Tau) were analyzed in hippocampal samples from transgenic P301S mice vaccinated with DNA-Φ/MVA-WT or DNA-Tau3RC/MVA-Tau3RC. AT8 (upper panel) and TAU-5 (lower panel) antibodies were used to detect phosphorylated and unphosphorylated tau protein, respectively. GAPDH has been used as a loading control. A quantification of all the bands of unphosphorylated and phosphorylated tau proteins detected by Western blot was made using ImageJ software, and the percentage of phosphorylated tau (PTau) vs. unphosphorylated tau (AT8/TAU-5) is shown in the graph, with error bars indicating the SEM. (E) Detection of phosphorylated tau by immunohistochemistry in dorsal dentate gyrus samples of vaccinated P301S mice. Immunohistochemistry was performed using the AT8 antibody to detect phosphorylated tau. Representative pictures from transgenic P301S mice vaccinated with DNA-φ/MVA-WT or DNA-Tau3RC/MVA-Tau3RC are shown. Scale bar: 20 μm. In the graph a quantification of the mean number of AT8 + cells per mm3 of dorsal dentate gyrus is shown; error bars indicate the SEM.

