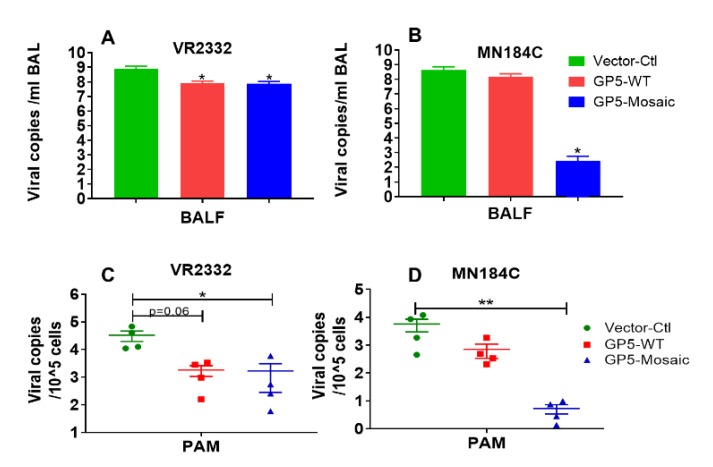
Figure 4.
Virus clearance in bronchioalveolar lavage fluids (BAL) and PAMs. (A) The viral copy numbers in BAL fluids at necropsy upon challenge with VR2332. (B) The viral copy numbers in BAL fluids at necropsy upon challenge with MN184C. Each bar represents the mean value of each group. Bars represent the standard error of the mean. Three independent experiments were performed for each. Significant differences were calculated by Student’s t test (* p < 0.05). (C) The viral copy numbers in PAMs at necropsy upon challenge with VR2332. (D) The viral copy numbers in PAMs at necropsy upon challenge with MN184C. Each dot represents the mean value of each animal. The bars represent the standard error of the mean. Three independent experiments were performed for each. Student’s t test was used to calculate significant differences (* p < 0.05, ** p < 0.01).

