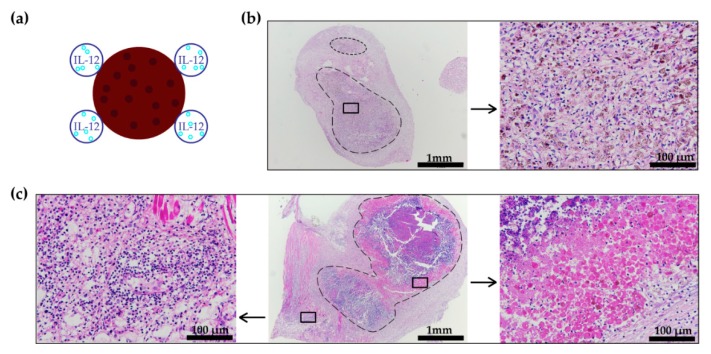
Figure 3.
Pilot B16-F10 vaccination histology. (a) Schematic presentation of the vaccine application and IL-12 GET. (b,c) H&E stained histological section of the skin at the location of the pilot vaccine injection and IL-12 GET. The dashed outline marks the area of the injected pilot vaccine. The squares mark further magnified areas. (b) The magnified image shows viable cells at the location of the injected NTC. (c) The right magnified image indicates a lower immune cell infiltration to the location of the injected NTC than to the site where IL-12 GET was performed, as shown on the left magnified image. H&E = hematoxylin and eosin staining. GET = gene electrotransfer; NTC = 1 unit of non-viable B16-F10 tumor cells (0.5 mg).

