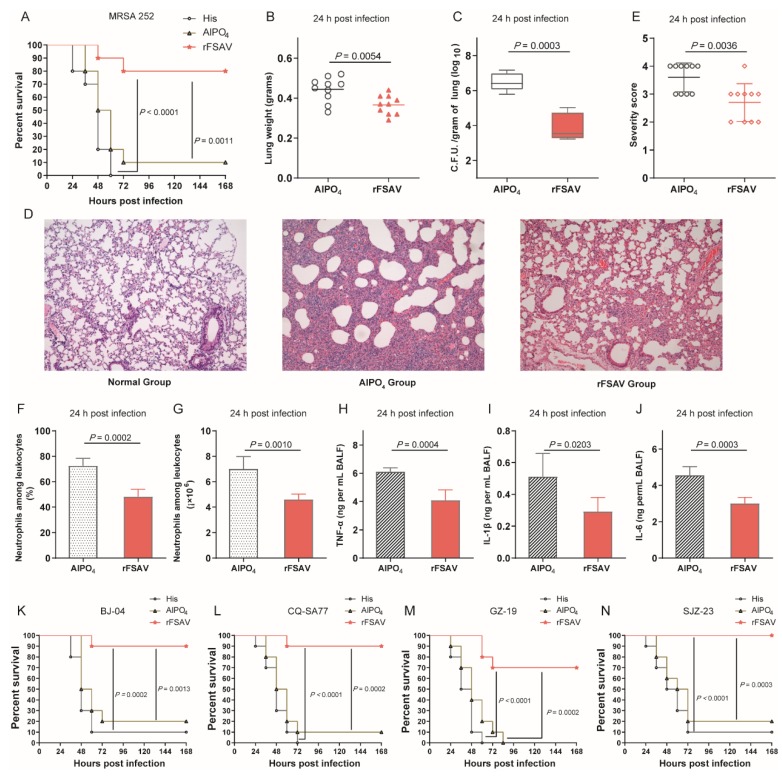
Figure 3.
Protective efficacy of rFSAV in a murine S. aureus pneumonia model. (A) Immunized and control C57BL/6 mice (n = 10) were challenged with MRSA252 at 1.0 × 10⁸ CFUs/mouse by intratracheal injection. (B–J) The immunized mice and control mice were infected intratracheally with MRSA252 at 5.0 × 10⁷ CFUs/mouse. (B) Lungs in infected mice (n = 10) immunized rFSAV were weighed. The data were presented as scatter plots. (C) The number of viable bacteria in the lungs of mice (n = 10) at 24 h post infection was shown. Data were presented in box and whisker plots, and the medians were shown. (D) Hematoxylin-eosin staining of lungs from mice 24 h post infection. Representative histopathological sections from 10 mice per group were shown (magnification = 100×). (E) Semi-quantification of lung inflammation. Severity scores of lungs (n = 10) from mice 24 h post infection were shown. The data were presented as scatter plots. (F,G) Evaluation of neutrophil infiltration in infected mice (n = 10). The bar represented the percentage (F) and the number (G) of neutrophils in the BALF of mice at 24 h post challenge. (H–J) Quantitative detection of proinflammatory cytokines TNF-α, IL-1β and IL-6 in infected mice (n = 10). The data (F–J) were shown as the means ± SD. (K–N) Immunized and control C57BL/6 mice (n = 10) were challenged with BJ-04, CQ-SA77, GZ-19 and SJZ-23 (9.0 × 10⁸, 4.0 × 10⁸, 3.0 × 10⁸ and 4.0 × 10⁸ CFUs/mouse, respectively) on 18 days. (A,K–N) The survival rates were recorded every 12 h over a 7-day observation period post challenge. The p-value was calculated using the Mantel-Cox log-rank test. The differences (B,C,E–J) were compared using Student’s t-test.

