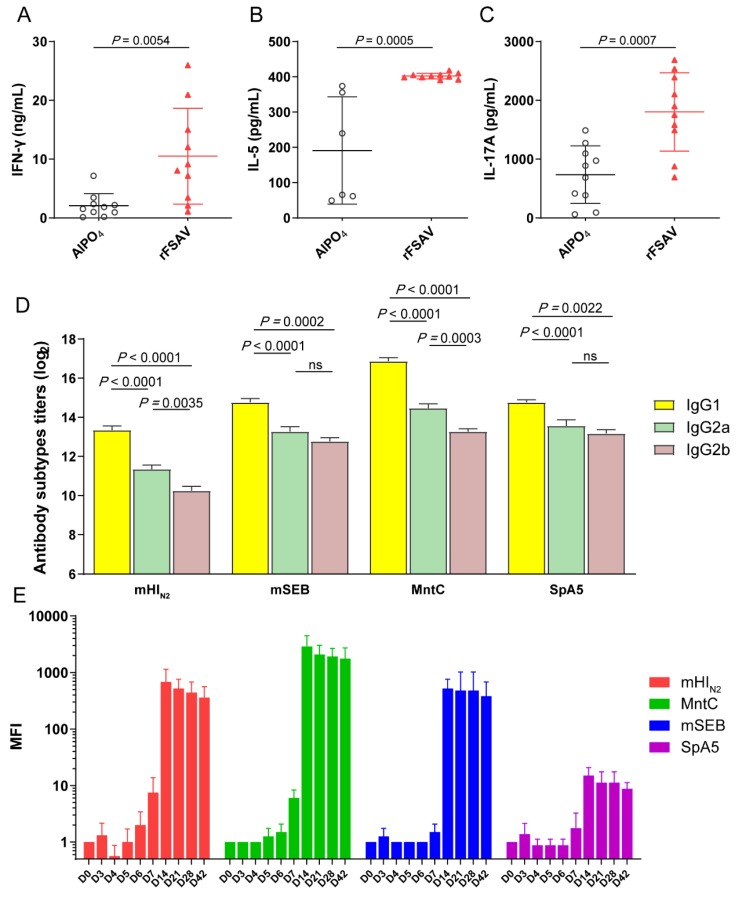
Figure 4.
Analysis of cytokine and antibody responses. (A–C) Comparison of cytokine production by antigens stimulated splenocytes from immunized and control mice. 10 days after the final immunization, spleens (n = 5) were processed and stimulated recombinant proteins, and the levels of IFN-γ, IL-5 and IL-17A in each culture supernatant were measured after 72 h. The differences were compared using Student’s t-test. (D) Comparison of serum IgG1, IgG2a and IgG2b subtypes among antigens in the immunized mice (n = 5). Serum was obtained at 10 days after the final immunization, and the levels of IgG1, IgG2a and IgG2b subtypes were expressed as the mean of log2 titers. (E) The specific IgG of mHIN2, MntC, mSEB and SpA5 in mice immunized with rFSAV was detected at each time point from days 0 to 42, and the levels of each antigen specific IgG were expressed as Mean Fold Increase (MFI). (D,E) Data were shown as the mean ± SEM. The p-values were calculated using one-way ANOVA (ns = no significance).

