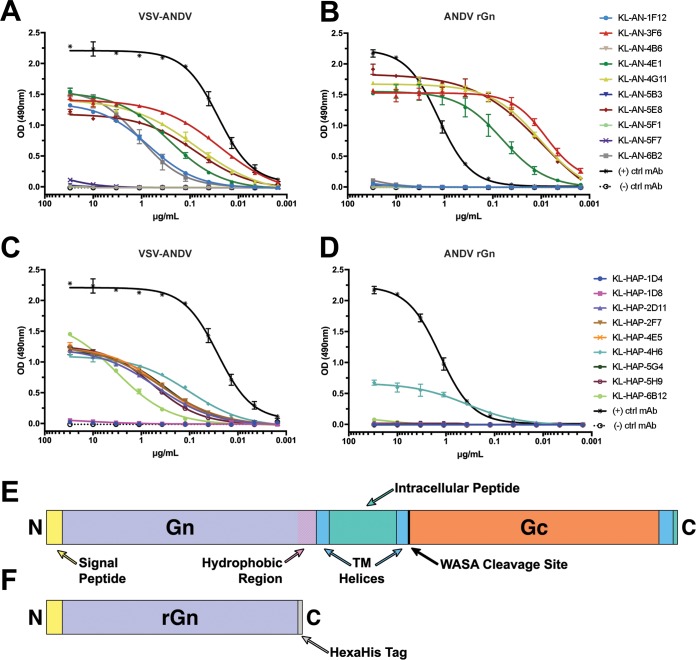
FIG 2.
ELISA reactivity against purified VSV-ANDV and rGn. (A) ELISAs of MAbs from the homologous “AN” hybridoma fusions against VSV-ANDV. Plates were coated with 5 μg/ml of purified VSV-ANDV, while MAbs were used in 1:3 serial dilutions beginning with 30 μg/ml. Data shown are the products from two replicates. The positive control was an anti-VSV-N MAb and common between panels A and C. The negative control was KL-2G12, an IgG2a MAb against Zaire ebolavirus GP. All trend lines are logarithmic regressions except where such regressions were not converged; in such cases, connecting lines were used. (B) ELISAs against recombinant ANDV Gn. The recombinant ANDV Gn was produced in insect cells via baculovirus expression. Plates were coated with 2 μg/ml of ANDV rGn, while MAbs were used in 1:3 serial dilutions beginning with 30 μg/ml. Data shown are the products from two separate experiments, two replicates each. The positive control was an anti-hexahistidine tag antibody and common between panels B and D. Negative control was KL-2G12, an IgG2a MAb against Zaire ebolavirus GP. (C) ELISAs conducted against VSV-ANDV as for panel A but with MAbs sourced from the heterologous “HAP” hybridoma fusions as described for Fig. S1. (D) ELISAs conducted against ANDV rGn as for panel B but with MAbs sourced from HAP fusions as described for Fig. S1. (E) Schematic of full GnGc with features indicated. (F) Schematic of recombinant Gn used in panels B and D. Transmembrane domains, the signal peptide, and the Gn hydrophobic region were annotated based on TMHMM analysis. Both schematics are to scale.

