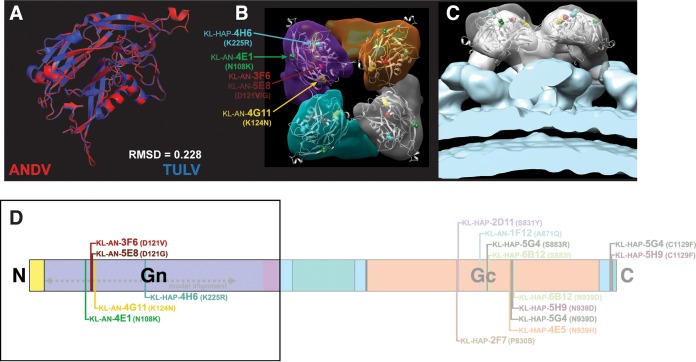
FIG 4.
Visualizing VSV-ANDV escape mutations on a computationally fit model of ANDV Gn. A model of ANDV Gn was created using TULV Gn as the template (PDB 5FXU). This model was then computationally fit into a TULV cryo-EM tomograph to depict the relationship between the Gn and the plasma membrane. (A) Structural alignment of ANDV model (red) and TULV Gn structure (blue). (B) Top view of the glycoprotein complex with escape mutations visualized on the model using colors as indicated. The tetramer is the assumed arrangement for ANDV, confirmed for TULV. (C) Side view including the plasma membrane shown in blue. (D) To-scale schematic of the ANDV GnGc showing the location of escape mutations and the alignment sequence used for structural modeling. RMSD, root mean square deviation.

