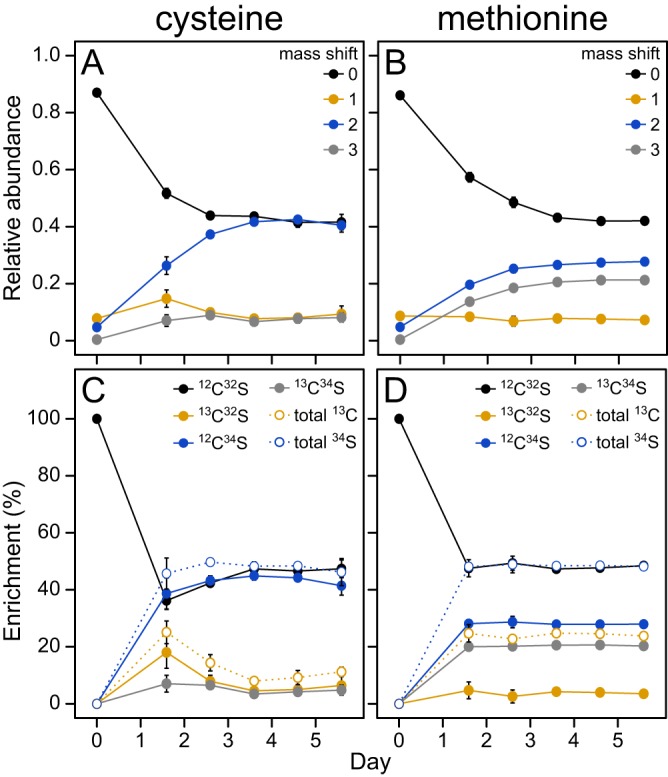
FIG 5.

Labeling profile of l-methionine and l-cysteine in an R. pomeroyi chemostat culture. All plots depict the labeling of the cellular l-methionine and l-cysteine for the 5 days following the addition of 100 μM DMSP (50.8% enriched with [13C, 34S]DMSP). The percent enrichment of each isotopomer (C and D) was calculated by correcting the observed relative abundances (A and B) for the natural abundance of isotopes and then correcting for the presence of legacy material in the samples as described in Materials and Methods. Error bars indicate the 95% confidence intervals and are not shown when they are smaller than the symbols.
