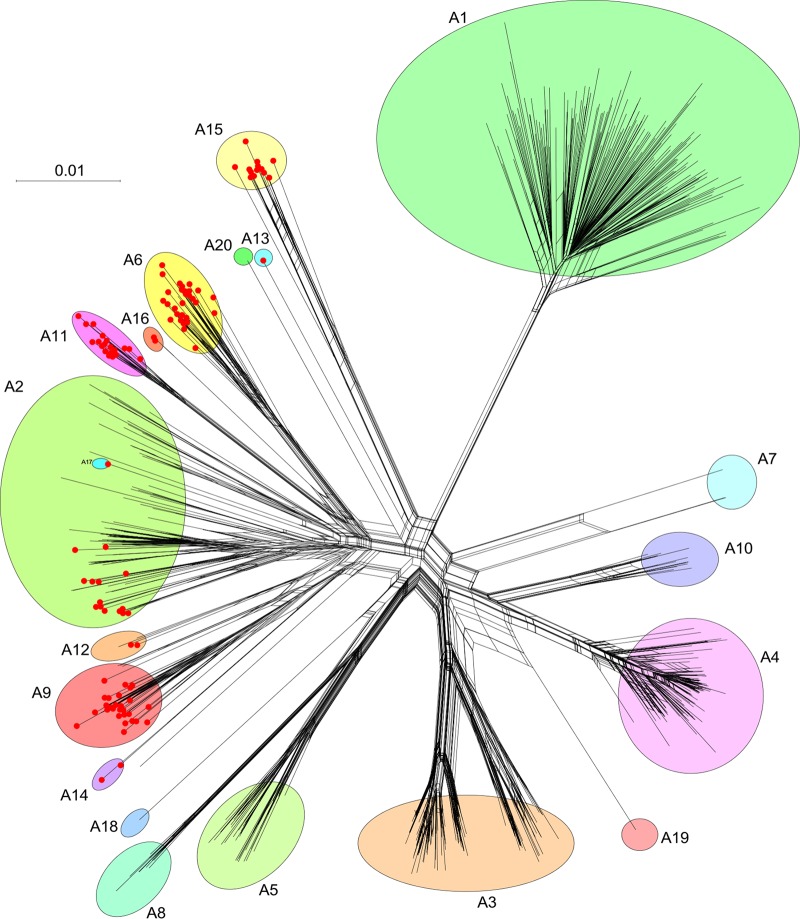
FIG 1.
Network phylogeny of cluster A mycobacteriophages. A network phylogeny of 621 cluster A mycobacteriophages was constructed based on gene content and represented using Splitstree (58). A database “Actino_Draft” dated 9 December 2019 was used in which predicted gene products were sorted into groups (phamilies) of related sequences as described previously (1, 59) (C. Gauthier and G. F. Hatfull, unpublished data), and a nexus-formatted file generated using the custom script “PhamNexus.” Colored circles illustrate the 20 subclusters (A1 to A20), and red dots at nodes indicate phages carrying parABS systems. The bar indicates the number of substitutions per site.

