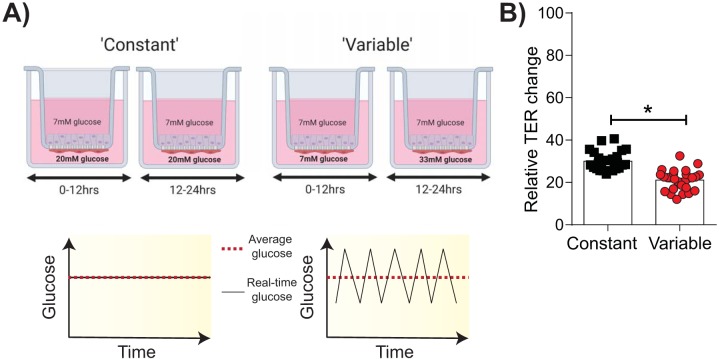
FIG 1.
Glycemic variability increases IAV-induced damage of the epithelial-endothelial barrier in vitro. (A) Schematic representation of the in vitro system used to model constant and variable blood glucose levels. Image created with BioRender. (B) Transepithelial electrical resistance (TER) 24 h after infection with IAV [A/Solomon Islands/03/2006(H1N1)]. Data are expressed relative to those for both the specific well’s baseline TER (i.e., prior to infection) and the mock-inoculated wells for the respective treatment groups. Data were pooled from three independent experiments, and the mean ± SEM is shown. Statistical significance was determined using a Mann-Whitney test. Statistical significance is indicated (*, P < 0.05).

