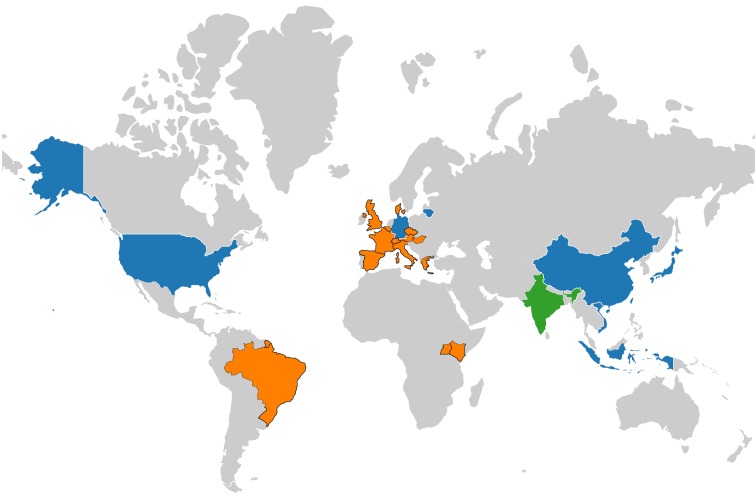
Figure 1.
Worldwide detection and distribution of Orthohepevirus C. Countries with both Orthohepevirus C RNA and antibodies detection are in blue; countries with only antibodies detection are in green; countries with only RNA detection are in orange. World map was created by using a free and open source geographic information system Quantum Geographic Information System version 3.10 (http://qgis.osgeo.org) and free vector and raster map data from Natural Earth (http://www.naturalearthdata.com).

