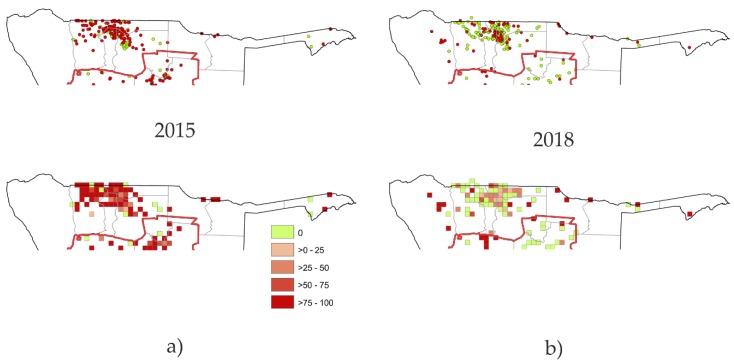
Figure 4.
Rabies surveillance data from the eight districts of the Northern Communal Areas (NCAs), (a) 2015, and (b) 2018. Laboratory confirmed rabies cases are indicated as red dots whereas samples with a negative test results are colored in greed (upper maps). Lower panel: Percentages of rabies positive samples within grid cells of 20 km × 20 km.

