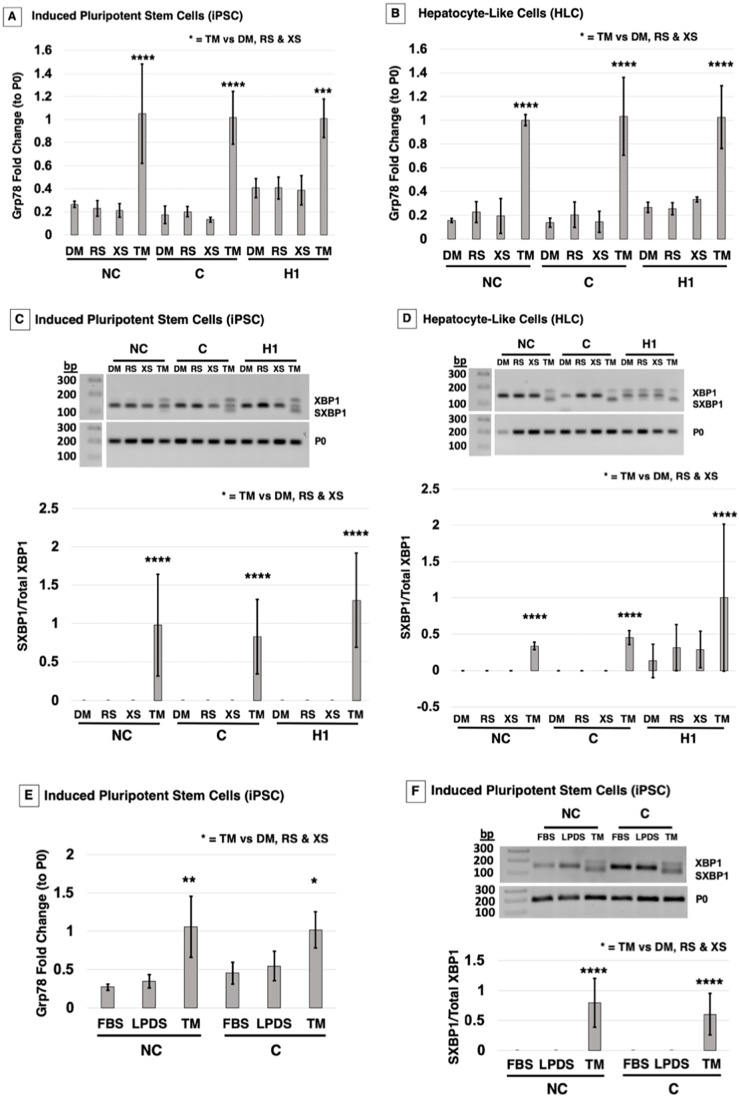
Fig. 4.
FH NC cells do not activate the UPR following rosuvastatin treatment. Following treatment with either carrier DM, RS, XS or tunicamycin (TM; 5 μg/ml for 4.5 h), cells were tested for ER stress and UPR markers at the mRNA level in iPSC/ESC and HLC. (A) qPCR analysis in iPSC indicated that Grp78 mRNA levels do not change with RS treatment compared to DM/XS controls across the three cell groups. TM significantly increased Grp78 mRNA in NC, C and H1 stem cells. (B) HLC presented the same trend, with TM significantly upregulating Grp78 transcripts, whereas RS did not. (C) PCR for spliced XBP1 (SXBP1) visualized on a 2% agarose gel indicated that TM treatment induced splicing of XBP1 that was not present in RS-treated iPSC/ESC. Quantification of SXBP1/XBP1 shows significant SXBP1/XBP1 activation in TM-treated cells across all three cell types. (D) HLC also showed significant changes with treatment, and response to TM was significantly different from that to DM, RS and XS within cell lines, but no XBP1 cleavage was detected across the cell lines without TM treatment. (E) iPSC were treated with LPDS only, FBS only or LPDS with TM. qPCR quantification in iPSC indicated a Grp78 mRNA level pattern that is significantly different in response to TM treatment, but not in response to LPDS or FBS treatment, across the three cell groups. (F) PCR for SXBP1 indicated that TM treatment induced splicing of XBP1 that was not present in LPDS- or FBS-treated iPSC/ESC. Quantification of SXBP1/XBP1 shows significant SXBP1/XBP1 activation in TM-treated cells across the three cell types. The graph values represent the mean±s.d. (n=3) per treatment, per cell type of three experiments repeated in the laboratory using a two-way ANOVA Holm–Sidak post-hoc test. *P<0.05, **P<0.01, ****P<0.0001 for TM treatment compared to all other treatments in each respective cell group.

