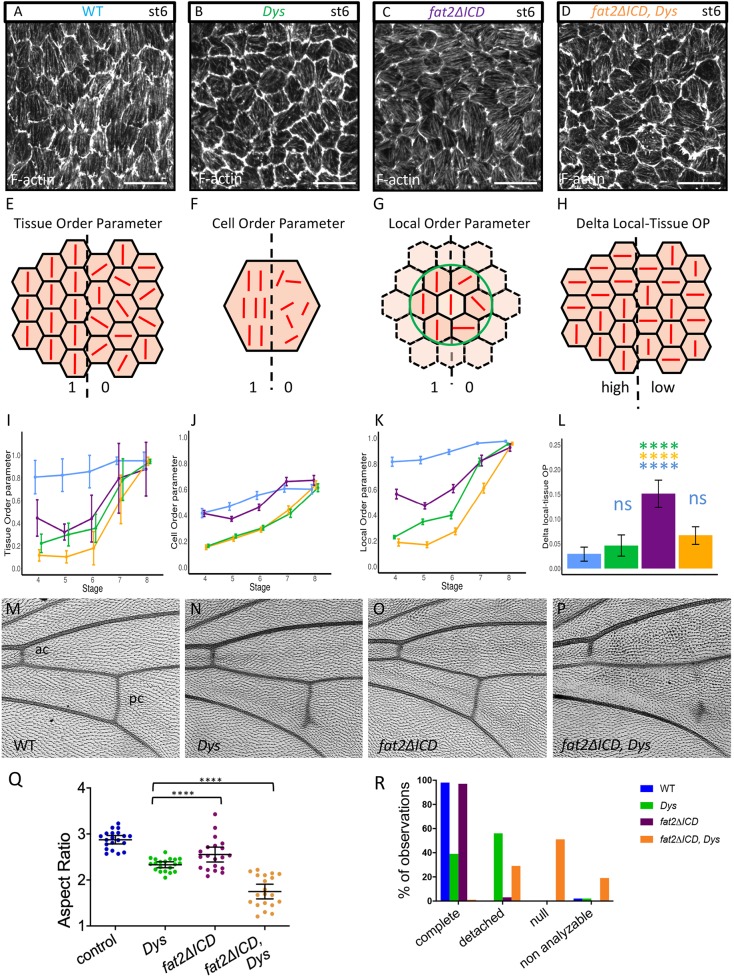
Fig. 4.
Genetic interaction between fat2 and Dys. (A-D) Representative images of stress fibers at stage 6 of WT (A), DysE17/Exel6184 mutant (B), fat2-DeltaICD mutant (C) and Dys, fat2-DeltaICD double mutant (D). Genotype color code is conserved on all panels. (E-H) Schemes explaining the different parameters that are analyzed in I-L: (E,I) Tissue OP (n>7 follicles for each stage and each genotype); (F,J) Cell OP; (G,K) Local OP; (H,L) difference between Local and Tissue OPs (n>171 cells for each stage and each genotype). (I-L) A two-way ANOVA was performed, followed by applicable post-hoc pairwise comparisons (Tukey). P-values between the different genotypes for I,J,K are indicated in Table S3. (M-P) Representative images of wing veins of WT (M), DysE17/Exel6184 mutant (N), fat2-DeltaICD mutant (O) and Dys, fat2-DeltaICD double mutant (P). ac, anterior crossvein; pc, posterior crossvein. (Q) Quantification of egg elongation for the indicated genotypes (n>20 eggs for each genotype, unpaired t-test). (R) Quantification of wing defects observed in the different genotypes on the pc. ‘Non analyzable’ corresponds to wrinkled or misfolded wings for which crossveins cannot be observed (n=40 wings). For all panels, error bars represent s.d.; ****P<0.0001. Scale bars: 10 µm.

