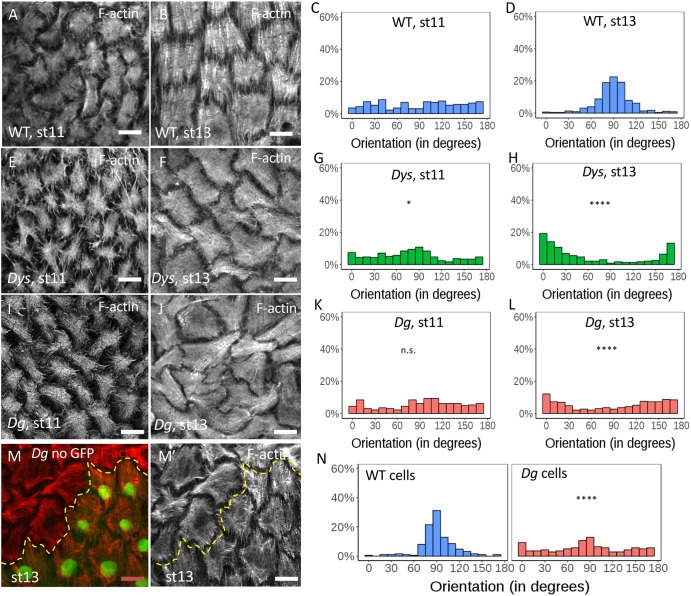
Fig. 5.
Stress fiber orientation defect in DAPC mutants during late stages. (A-L) Representative images of basal F-actin in WT (A,B), DysE17/Exe6184 (E,F) and DgO86/O43(I,J) follicles at stages 11 and 13 and quantification of the corresponding angular distribution (C,D,G,H,K,L) (n>5 follicles). (M-N) Representative image of basal F-actin in Dg mutant clone marked by the absence of GFP (M,M′) and quantification of the corresponding angular distribution of stress fibers in the mutant cells and the neighboring WT cells (N) (n>5 clones ). Angular distribution was compared with that of WT at same stage (and statistically analyzed as described in the Materials and Methods); *P<0.01, ****P<0.0001. n.s., not significant. Scale bars: 10 µm.

