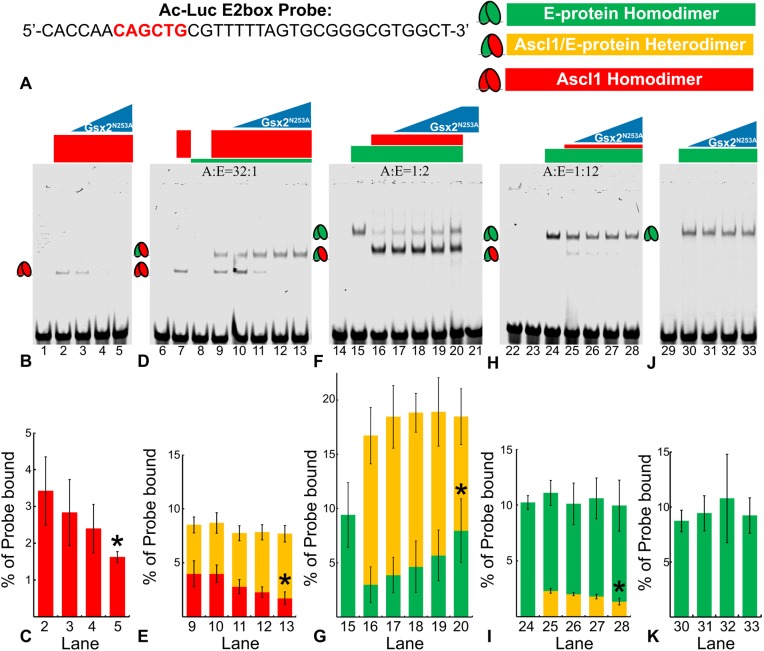
Fig. 6.
Gsx2 interferes with Ascl1 homodimer and heterodimer binding to an E-box DNA sequence. (A) Sequence of the E-box (highlighted in red) probe used in lanes 1-33 of EMSAs shown in B-K. (B) Gsx2 DNA binding mutant, Gsx2N253A, is titrated in increasing amounts from 0 to 80 pmoles in samples containing a constant 2.5 pmoles of Ascl1. (C) Percentage of probe bound by Ascl1-Ascl1 homodimers (red bars) in lanes 2-5. (D) Ascl1 (2.5 pmoles) and E-protein (0.08 pmoles) were added in a 32:1 ratio in each lane (9-13) with increasing levels of Gsx2N253A from 0 to 80 pmoles. (E) Percentage of probe bound by Ascl1-Ascl1 homodimers (red) and Ascl1-E47 heterodimers (yellow) in lanes 9-13. (F) Ascl1 (0.15 pmoles) and E-protein (0.3 pmoles) were added in a 1:2 ratio in each lane (16-20) with increasing levels of Gsx2N253A from 0 to 80 pmoles. (G) Percentage of probe bound by Ascl1-E47 heterodimers (yellow) and E47-E47 homodimers (green) in lanes 15-20. (H) Ascl1 (0.026 pmoles) and E-protein (0.31 pmoles) were added in a 1:12 ratio in each lane (25-28) with increasing levels of Gsx2N253A from 0 to 80 pmoles. (I) Percentage of probe bound by Ascl1-E47 heterodimers (yellow), and E47-E47 homodimers (green) in lanes 24-28. (J) E-protein (0.3 pmoles) was added to each lane (30-33) with increasing levels of Gsx2N253A from 0 to 80 pmoles. (K) Percentage of probe bound by E47-E47 homodimers (green) in lanes 30-33. Each EMSA was performed in triplicate, and data in C,E,G,I,K represent mean±s.d. with the intensity of bands representing each complex normalized to total probe intensity. Note, the y axes in C,E,G,I,K are different scales in order to accentuate the relative changes. An unpaired, two-tailed Student's t-test was performed between the no Gsx2N253A condition and the maximum Gsx2N253A condition, *P<0.05.

