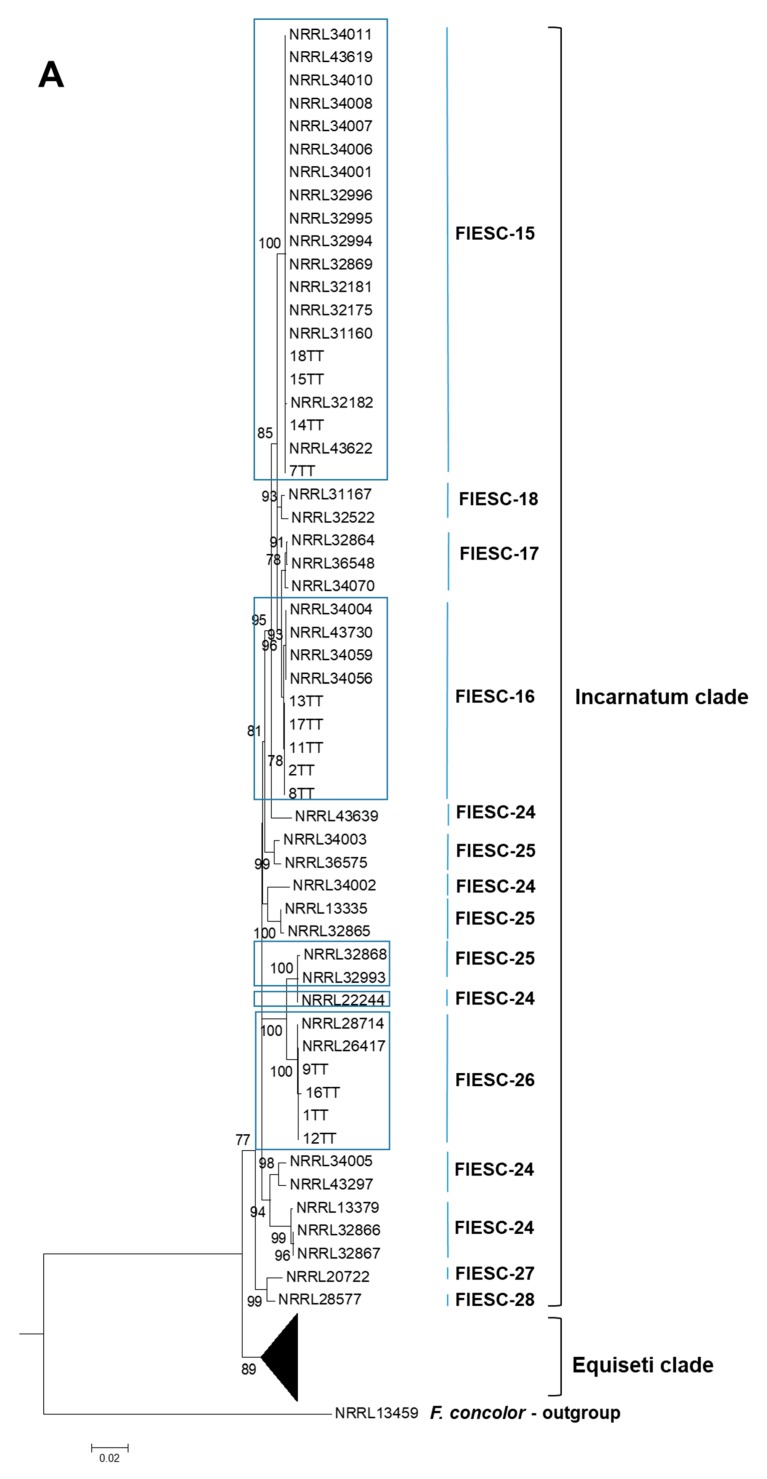
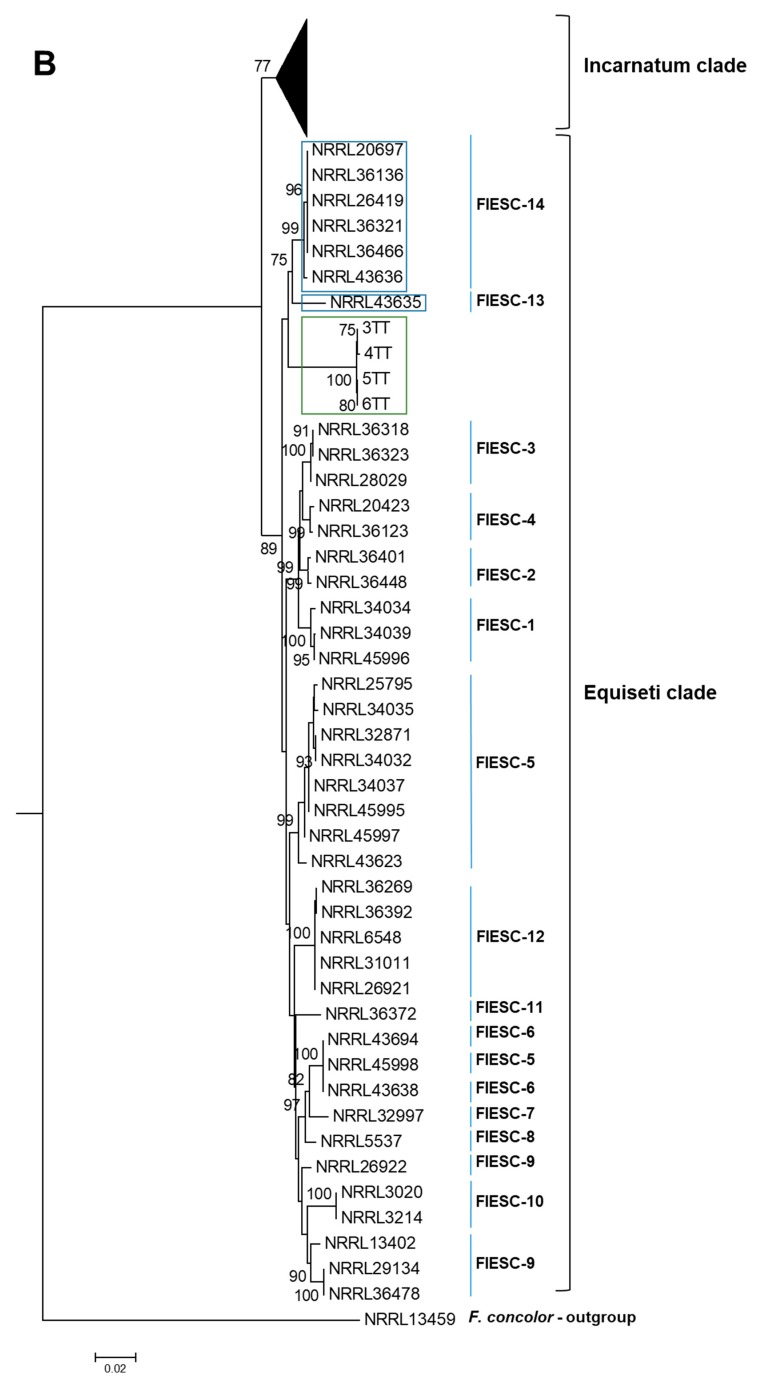
Figure 1.
(A,B). Phylogenetic analysis of FIESC sequences based on concatenated partial nucleotide sequences of EF-1α, RPB2, and CAM genes. The phylogenetic relationships were inferred by using the Maximum Likelihood method based on the General Time Reversible model, as the best fit model, with 1000 bootstrapped replicates [50]. The tree with the highest log-likelihood is shown. The percentage of trees in which the associated taxa clustered together is shown next to the branches. The tree is drawn to scale, with branch lengths measured in the number of substitutions per site. The analysis involved 103 nucleotide sequences. All positions containing gaps and missing data were eliminated. There were a total of 1804 positions in the final dataset. Evolutionary analyses were conducted in MEGA6 [51]. Black triangle depicts a collapsed branch; blue boxes indicate sequences belonging to a confirmed FIESC haplotype; green box indicates unresolved Trinidad Equiseti sequences.


