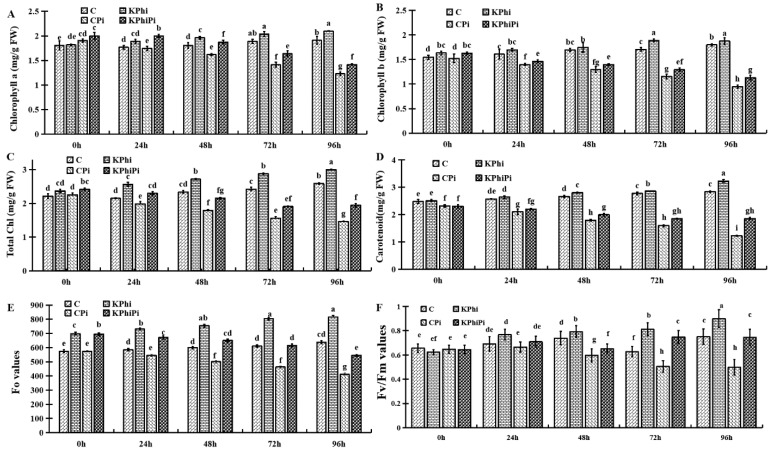
Figure 2.
Photosynthetic changes in potato leaves. Chl a (A), Chl b (B), total Chl (C), Car (D) and Chl fluorescence, Fo value (E) and Fv/Fm value (F), C (control), KPhi (leaves treated with KPhi), CPi (control leaves inoculated by P. infestans), KPhiPi (leaves inoculated three days after last KPhi application). Means not sharing a common letter within the same letters in the graph are significantly different at p < 0.05 according to Tukey’s test.

