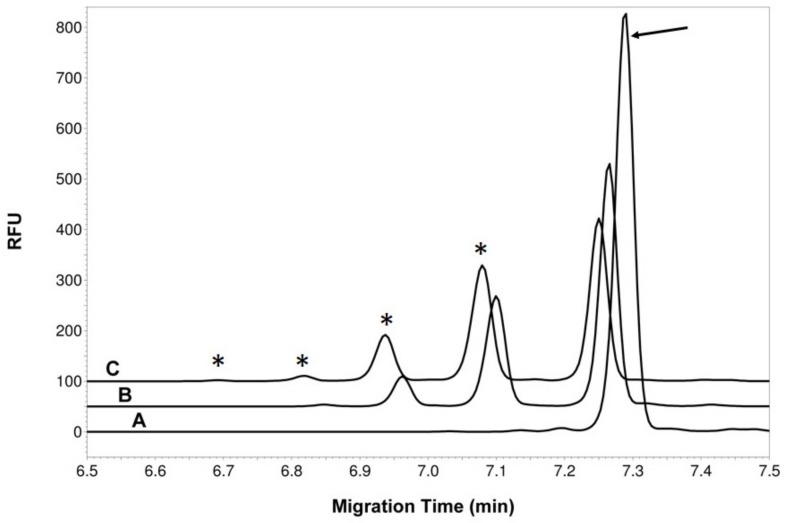
Figure 3.
Capillary electrophoresis (CE) analysis of the MalE-SgtA reaction products. Electropherogram A is the acceptor alone (SML3 peptide labeled with FITC-Ahx, peak indicated by arrow) incubated for 24 h in presence of MalE-SgtA but without donor. Electropherogram B shows the complete reaction mix after 1 h incubation. Electropherogram C shows the complete reaction mix after 24 h incubation. The “*” indicates product peaks with added GlcNAc residue. The traces are shifted by 0.2 min to facilitate viewing of the peaks.

