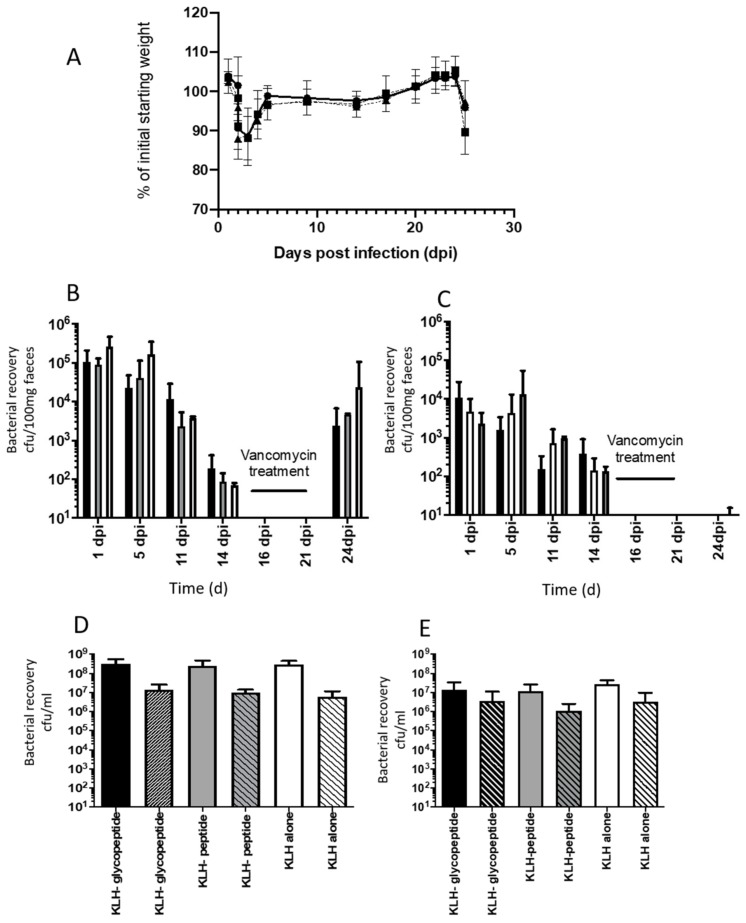
Figure 8.
Impact of intranasal vaccination of mice with KLH peptide conjugates + CT on acute and relapsing C. difficile disease. (A) represents changes in average percentage (%) change in the weight of the mice following C. difficile challenge. Each point presents the average weight of animals immunized with either KLH-glycopeptide + CT (circle), KLH-peptide + CT (inverted triangle), and KLH + CT alone (black square). Error bars represent the standard deviation of the mean for 8–9 mice per group. (B) reflects the recovery of both vegetative and spores in the feces of mice on days post challenge with C. difficile (days post infection, dpi). The mean bacterial recovery (cfu/100g of feces) from animals immunized with KLH-glycopeptide + CT (black square), KLH- peptide + CT (grey square), and KLH + CT (white square) from 8–9 mice per group is shown. Error bars represent the standard deviation from the mean. (C) represents analysis of the spores within the samples highlighted in Figure 6B and were calculated by from serial dilutions of samples following treatment of these samples at 65 °C for 30 min. (D) represents the recovery of C. difficile from caecal samples collected at the experimental endpoint on day 25. Mean bacterial total counts from 8-9 animals immunized intranasally with KLH-glycopeptide + CT (black square), KLH-peptide + CT (grey square), or KLH + CT (white square) are shown in single blocked colors and spore counts from the same groups are highlighted by patterned blocks. Error bars represent the standard deviation from the mean of these counts. (E) represents the equivalent recovery of C. difficile from colonic samples from the same animals, with total recovery of C. difficile represented by solid blocks of color and spore counts by patterned blocks. Error bars represent the standard deviation from the mean of these counts.

