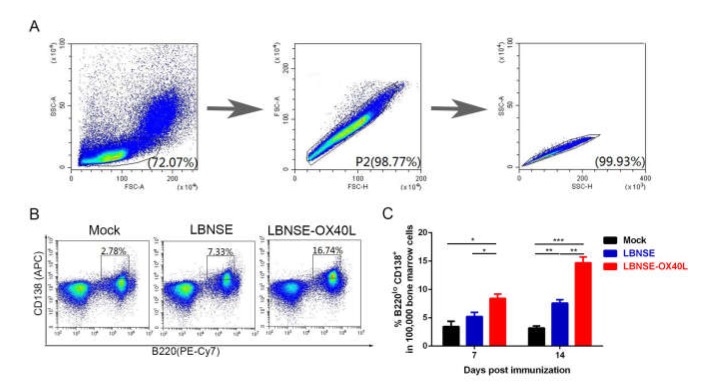
Figure 5.
Generation of plasma cells (PCs) in mice immunized with LBNSE-OX40L. Moreover, 105 single bone marrow (BM) cells from the immunized mice were collected and stained with PE-Cy7-B220 and APC-CD138 for analyzing the induction of PCs by flow cytometry. Cell populations of interest were visualized by pseudocolor plots (A and B) showing their FSC and SSC signals in relation to the size and granularity/complexity of the cells, respectively. The representative gating strategies and contour plots of lymphocyte populations in BM cells (A), and PC (B220loCD138+) populations in BM lymphocyte (B) were shown. (C) At 7 and 14 dpi, the percentage of PCs within 105 BM cells was analyzed. Error bars represented the SE (n = 3). The following notations were used to indicate significant differences between groups: *, p < 0.05; **, p < 0.01; ***, p < 0.001.

