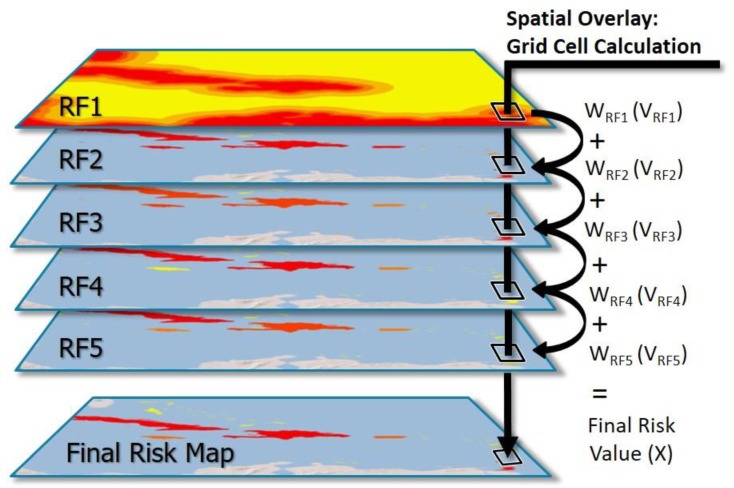
Figure 2.
Risk map spatial overlay and grid cell calculation. Visualization of the spatial overlay of each risk factor (RF) raster file to create the final risk map. Within each grid cell of a RF layer, the grid cell value (V) was multiplied by the weight of its RF layer (W), and these values were then summed between all correlating grid cells to get a final risk value (X).

