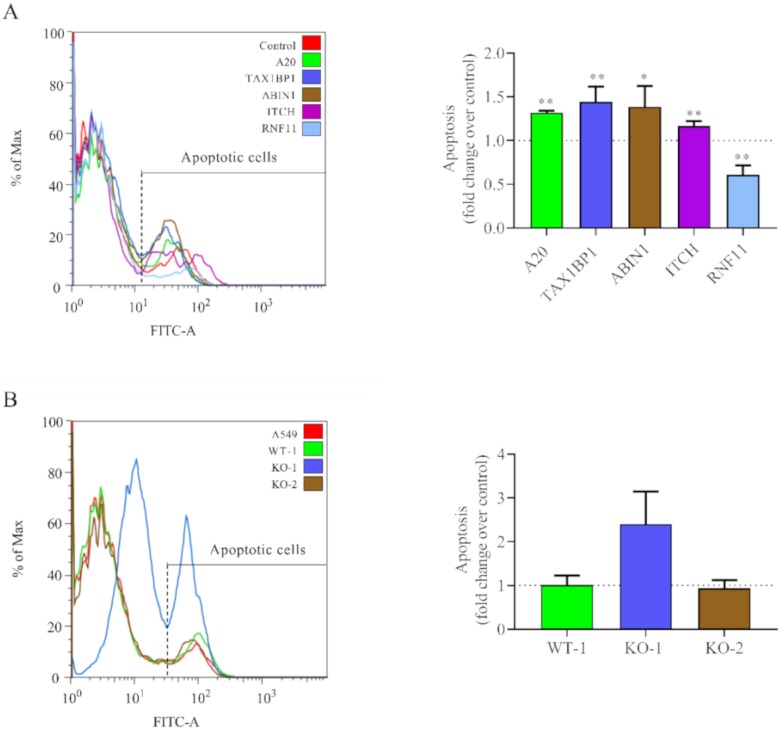
Figure 6.
Apoptosis levels in siRNA-treated or A20 KO cells. (A) Cells were transfected with the indicated siRNAs (control, A20, TAX1BP1, ABIN1, ITCH, and RNF11) and infected 24 h later at a MOI of 3. (B) Wild-type and A20 KO cells were infected at a MOI of 3. In all cases, cells were harvested at 48 hpi and apoptosis was quantified via flow cytometry by AnnexiV-AlexaFluor488TM and SytoxTM staining. The left panels show results from one representative experiment, and the right panels represent the mean (fold-over control) and standard deviation from three independent experiments. Controls are siRNA control in (A) and parental A549 cells in (B). Pairwise comparisons between cells treated with the siRNA control and a specific siRNA (A) or A549 cells with the cell lines (WT-1, KO-1 or KO-2) (B) were done by the t-test. From the p values obtained, FDRs were calculated: *, q-values < 0.05 and **, q-values < 0.01.

