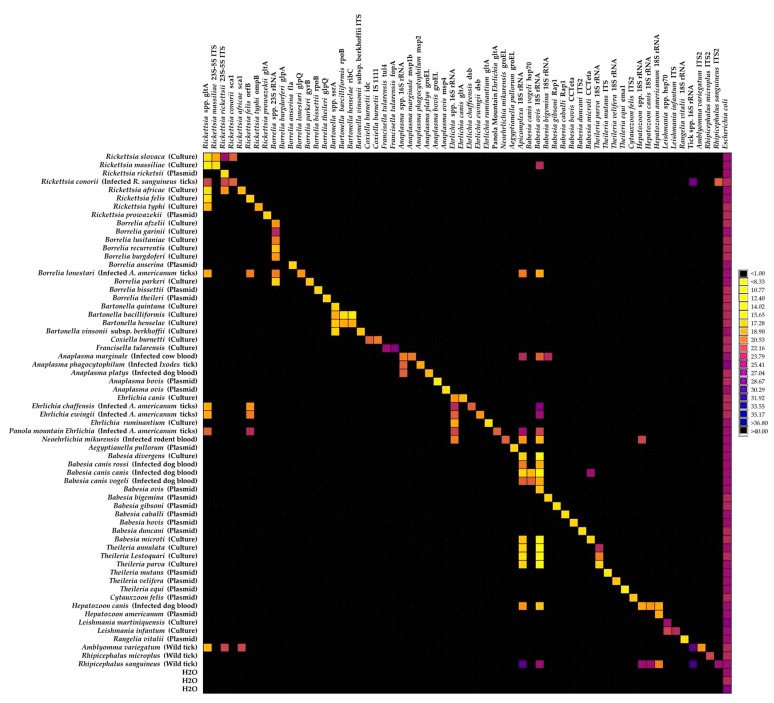
Figure 1.
BioMarkTM dynamic array system specificity test (96.96 chip). Each square corresponds to a single real-time PCR reaction, where rows indicate the pathogen in the sample and columns represent the target of the primer/probe set. Ct values for each reaction are represented by a color gradient; the color scale is shown on the right y-axis. The darkest shades of blue and black squares are considered as negative reactions with Ct > 30.

