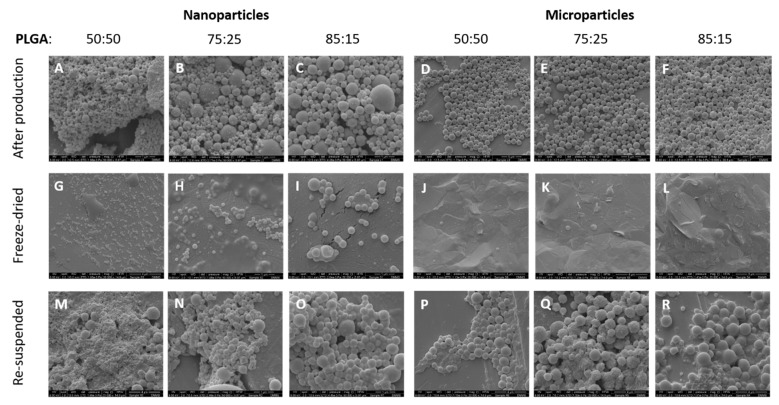
Figure 3.
Scanning electron microscope (SEM) images of the antigen loaded PLGA nanoparticles and microparticles with different copolymer ratio (50:50, 75:25 and 85:15), (A–F) after production, (G–L) after freeze-drying (powder state) and (M–R) after re-suspension in ultrapure water. The scale-bars shown at the bottom of each image represent 1 micron (A–C,H,I,N,O), 5 microns (D,E,F) or 4 microns (G,J–M,P–R).

