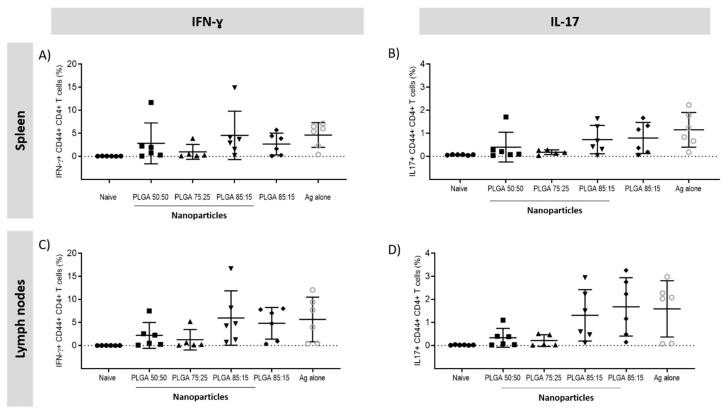
Figure 12.
Percentage of IFN+CD4+CD44+ and IL-17+CD4+ CD44+ producing T cells measured by intracellular staining in the splenocytes and lymph nodes of vaccinated mice. T cell responses following vaccination 2 × s.c. CAF01:H56 and 1 × i.n. PLGA:H56 in CB6F1 mice (n = 6). Two weeks after intranasal boosting with the antigen, the cells were stimulated with H56 antigen and cytokine production was assessed by icFACS: Percentage of (A) IFN-γ and (B) IL-17 in the spleen; percentage of (C) IFN-γ and (D) IL-17 cytokines in the lymph nodes.

